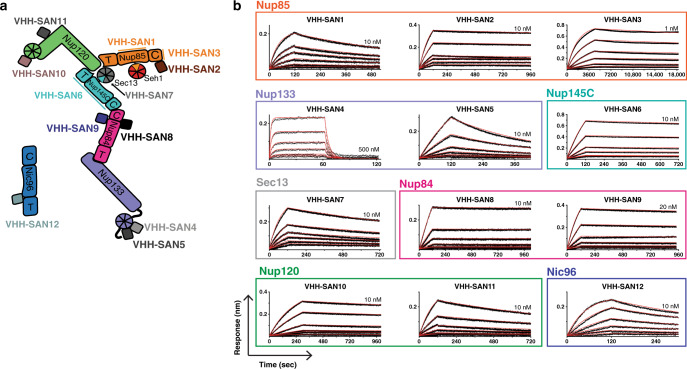
Fig. 2. Bio-layer interferometry of nanobody-nup binding.
a Schematic of the Y complex and Nic96 with the nanobody library. b Binding curves showing association and dissociation kinetics for each nanobody-nup pair. Nanobodies with a biotinylated C-terminal Avi-tag were fixed (ligand) and nups were used as analytes. Curves were corrected for buffer background. Each set of curves is a twofold dilution series from the highest concentration listed on each plot. Experimental data are shown as black dotted lines with red lines indicating globally fitted curves. Axis labels for all plots are indicated in the bottom left.

