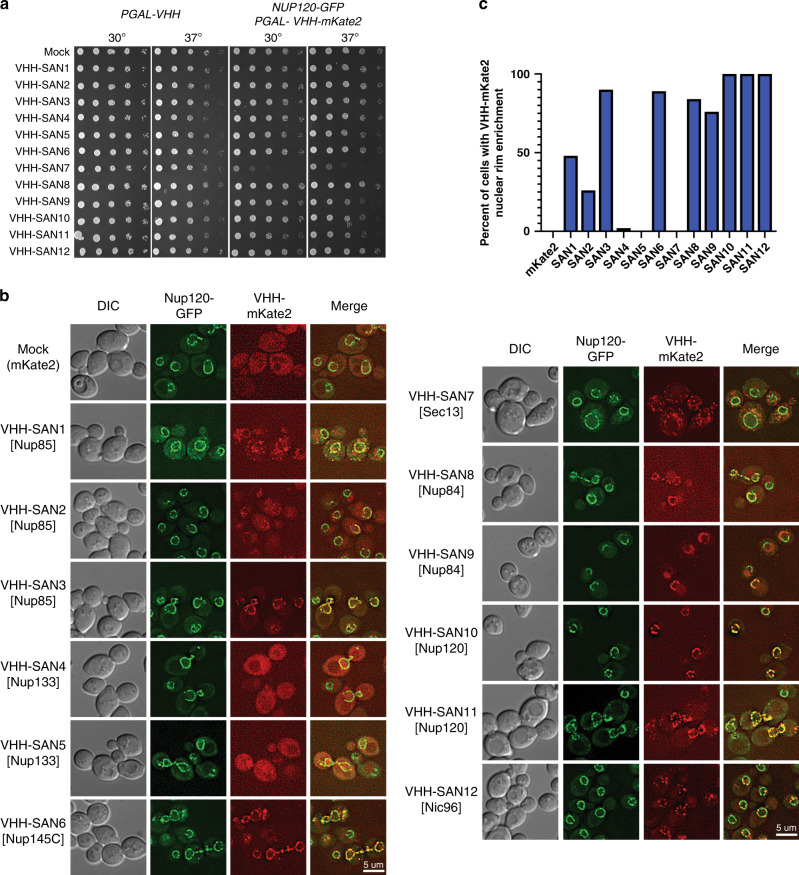
Fig. 6. Expression of nanobody-mKate2 fusions in vivo.
a Spot assays for nanobody and nanobody-mKate2 expression. Strain construction is indicated at the top of the figure, along with assay temperature. Pictures were taken after 48 h on 2% galactose containing agar media. Mock specifies mKate2 expression alone. b Fluorescence images of cells expressing endogenously tagged Nup120-GFP and plasmid expressed NUP120-VHH-mKate2 in DIC, GFP, and far-red channels with a merged overlay. Target of each nanobody is listed in brackets. Scale bar: 5 μM. c Percent of cells with VHH-mKate2 exhibiting nuclear rim enrichment, n = 50 cells per strain over one experiment.

