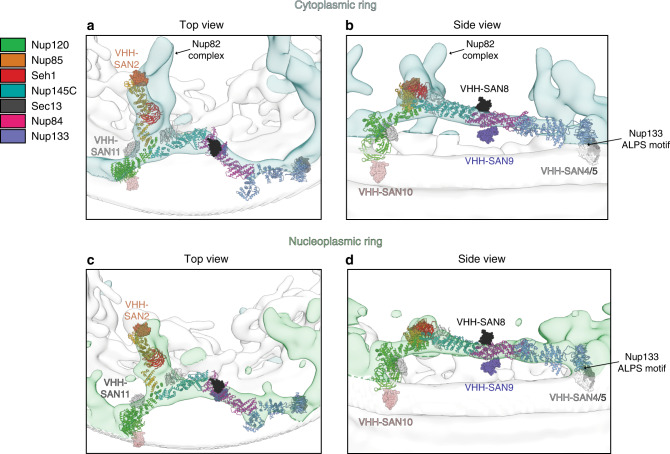
Fig. 7. Docking of the Y complex and nanobodies into the cryo-ET map of the NPC.
a Top and b side view of the cryo-ET map from S. cerevisiae (EMD-10198) with the density for corresponding to the cytoplasmic ring of the NPC colored in light blue. A top-scoring global fit for the composite S. cerevisiae Y complex model shown in both a top and side view. Y complex nups colored as indicated in the legend (right). Nanobodies were not included during global fitting, nanobody-nup complexes were superposed after docking. Nanobodies are shown with surface rendering and labeled with matching colors. Density corresponding to the Nup82 complex is indicated. The position of the Nup133 ALPS motif adjacent to the nuclear envelope is also indicated. c Top and d side view cryo-ET map with the density corresponding to the nucleoplasmic ring of the NPC colored in light green. Top-scoring global fit for the composite S. cerevisiae Y complex model shown in both a top and side view. Nanobody positioning, coloring, and labeling as in a, b.

