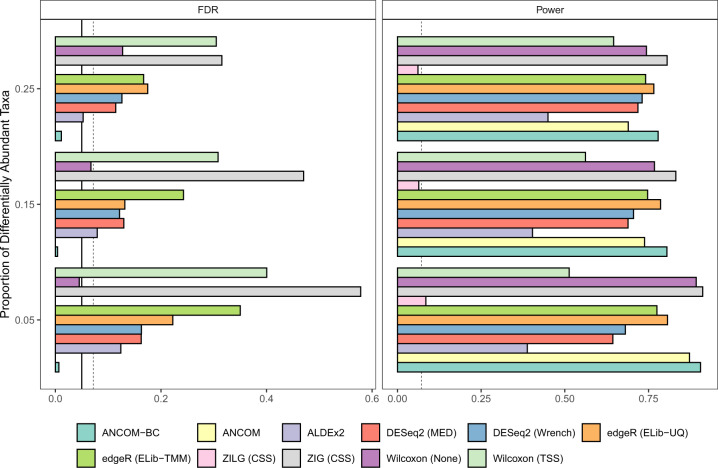
Fig. 4. False Discovery Rate (FDR) and power comparisons using synthetic data.
The FDR and power of various differential abundance (DA) analyses (two-sided) are shown in a, b, respectively. The number of taxa is set to be 200, and the sample size equals to 60, with 30 samples per group. The microbial absolute abundances in the ecosystem are generated from the log-normal distribution. The y-axis denotes patterns of proportion of differential abundant taxa, ranging from 0.05 to 0.25. The solid vertical line is the 5% nominal level of FDR, and the dashed vertical line denotes 5% nominal level plus one standard error (SE). Legend on the bottom indicates the color for each method and the normalization method is provided within parenthesis. By default, ANCOM-BC implements Holm-Bonferroni70 method and other DA methods implement BH procedure57 to adjust for multiple comparisons. By detecting differentially abundant taxa between two groups, results show that only ANCOM and ANCOM-BC control the FDR under the nominal level (5%) while maintaining power comparable to other methods. Gaussian model version of metagenomeSeq has highly inflated FDR, while the log Gaussian version has substantial loss of power, sometimes well below 5%.

