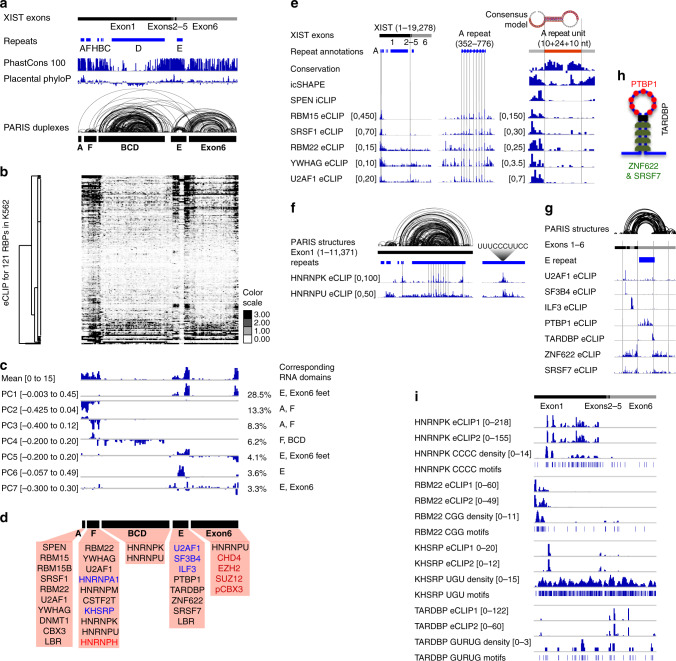
Fig. 2. eCLIP analysis of XIST-associated proteins reveals modular domains.
a Annotation of human XIST exons, repeats, phylogenetic conservation, and HEK293 PARIS data, same as Fig. 1d. b Unsupervised clustering of XIST–protein interactions in 100-nt windows for 121 proteins (242 samples). c PCA analysis of eCLIP data. The mean and first seven components are displayed together with variation explained by each. d Proteins associated with each domain. Black and blue letters: enriched proteins based on eCLIP. Black: broad and clustered binding. Blue: focal binding. Red: enriched proteins based on fRIP-seq. e RBP interactions on the A domain. Left panel: enrichment of 6 RBPs along XIST based on eCLIP. The three vertical lines highlight the A-repeat region and the SRSF1 and U2AF1 peaks on exon 2. Middle panel: zoom-in to the A-repeat domain and the vertical lines indicate protein crosslink positions on the repeat units. Right panel: average signal on a single 24-nt repeat with 10-nt flanking spacers on each side, and the vertical lines mark the start and end of the 24-nt repeat sequence. Conservation, icSHAPE, and SPEN iCLIP data were from ref. 27. f RBP interactions on the BCD domain. Left panel: HEK293 PARIS data, repeats, and eCLIP data are shown for the entire exon 127. Vertical lines mark the BCD domain boundaries and the internal repeats in the D-repeat. Right panel: the average of all D repeats (290 nts per unit) and the consensus HNRNP-binding site. g RBP interactions on the E domain. Parts of exons 1 and 6 and the entire exons 2–5 are shown together with HEK293 PARIS data27. The vertical lines mark the boundaries of the stem and loop regions. h RBP interaction model for the E domain. i Comparison of protein-binding sites on XIST based on eCLIP and sequence motifs. eCLIP data are normalized against size-matched input in 100-nt windows. The density profile was calculated based on sequence motifs in 300-nt windows and 50-nt steps. Source data are provided as a Source data file.

