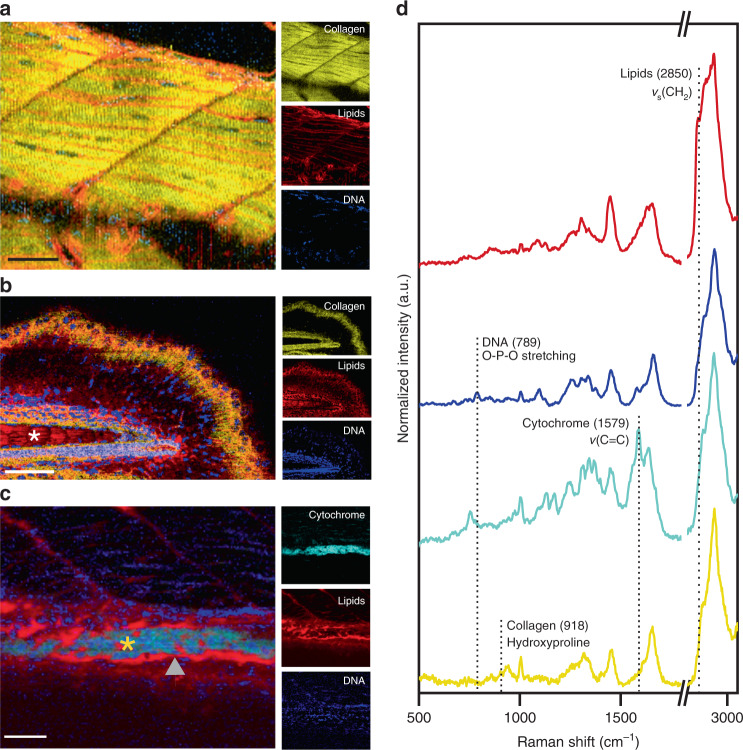
Fig. 3. High-resolution confocal Raman spectroscopic imaging for anatomical tissue characterization.
Confocal Raman spectroscopic imaging (cRSI) was used to image tissue regions of interest at 3 days post fertilization, with a spatial resolution of 0.5–1 µm. Univariate analysis was performed by integrating over a wavenumber range corresponding to relevant biomolecules: collagen-rich regions at 918 ± 20 cm−1 (shown in yellow), DNA-rich regions at 789 ± 10 cm−1 (shown in blue), lipid-rich regions at 2850 ± 10 cm−1 (shown in red), cytochrome-rich regions at 1579 ± 15 cm−1 (shown in cyan). a A representative image of the dorsal muscle tissue, from three independent cRSI scans (N = 3). Scale bar: 40 µm. b An exemplar scan of the tail tissue of a single embryo (N = 1), with the white asterisk indicating the notochord. Scale bar: 50 µm. c An exemplar scan of the developing gut of a single embryo (N = 1), with the orange asterisk marking the gut lumen and the grey triangle points indicating the gut lining. Scale bar: 40 µm. d Exemplar Raman spectra obtained from regions of intense univariate signal, with the labeled peaks used for univariate analysis.

