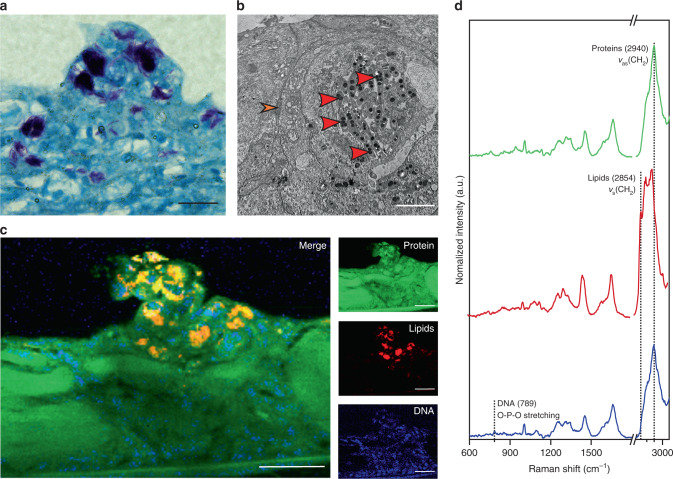
Fig. 4. Confocal Raman spectroscopic imaging analysis of zebrafish embryo model of tuberculosis.
An established model was used in which zebrafish embryos were injected with M. marinum to form localized mycobacterial lesions. All analysis was performed at 4 days post injection. a The model was verified by staining the lesions with a Ziehl–Neelsen stain, highlighting acid-fast mycobacteria (regions of purple), with a representative image selected from three independent biological replicates (N = 3). Scale bar: 20 µm. b Transmission electron micrograph of a mycobacterial lesion, a representative image of two independent biological replicates (N = 2). Osmium staining revealed the presence of mycobacteria (red arrows) with dense lipid clusters (stained black). The plasma membrane of the host cell is also visible (orange arrow). Scale bar: 2 µm. c Confocal Raman spectroscopic imaging (cRSI) was used to image mycobacterial lesions. The image shown is representative of four independent biological replicates (N = 4). Univariate analysis was performed by integrating over a wavenumber range corresponding to relevant biomolecules: protein-rich regions at 2940 ± 16 cm−1 (shown in green), lipid-rich regions at 2854 ± 10 cm−1 (shown in red), DNA-rich regions at 789 ± 10 cm−1 (shown in blue). Scale bars: 40 µm. d Representative spectra obtained from cRSI.

