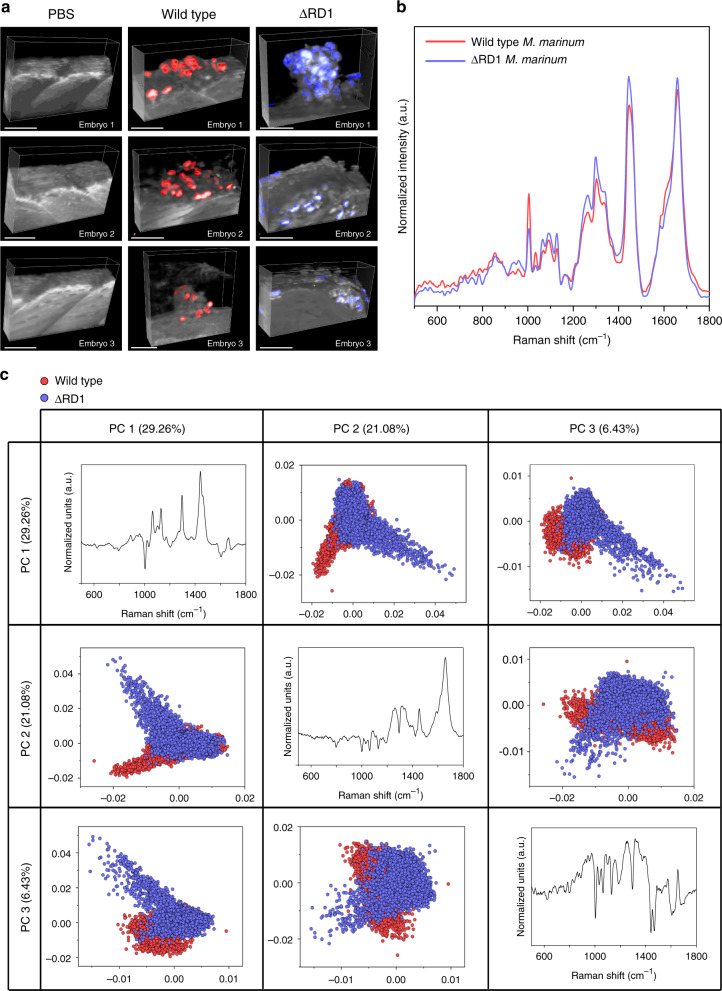
Fig. 5. Biomolecular profiling and discrimination of mycobacterial infections.
a Volumetric confocal Raman spectroscopic imaging (cRSI) of zebrafish embryos infected with either wild type or ∆RD1 M. marinum or injected with PBS as a negative control. cRSI was performed at 4 days post injection, and 3D reconstructions show embryo tissue in gray with mycobacterial clusters displayed in red (wild type) or blue (∆RD1). Scale bars: 50 µm. b Mean spectra of the mycobacterial clusters extracted from the volumetric cRSI scans for wild type M. marinum (red trace) and the ∆RD1 mutant bacteria (blue trace). c Principal component analysis showed clear separation of the wild type M. marinum (red markers) and the ∆RD1 mutant bacteria (blue markers) using the three principal components (PC1, PC2, PC3).

