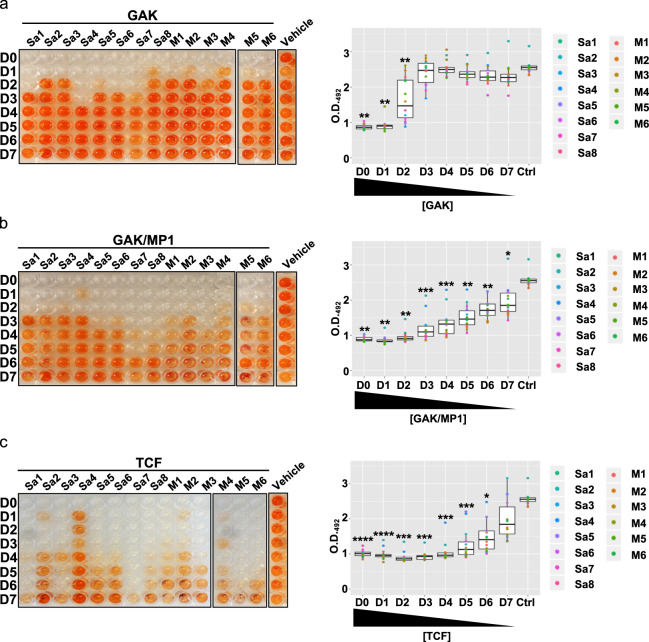
Fig. 4. Sensitivity of the clinical S. aureus strains to garvicin KS alone, in combination with micrococcin P1, and to the tricomponent formulation.
The indicated strains were treated with garvicin KS (a), micrococcin P1 (b), or the tricomponent formulation (c). Representative images of the BOAT assay performed are shown in the left panel while the corresponding boxplots analyzing the trend of metabolic activity recovery are shown in the right panel. The assays were performed on eight methicillin-sensitive (Sa1–8) and on six methicillin-resistant (M1–6) strains. In the vehicle columns, the strain MRSA6 (M6) was used as a representative of the outcome for all vehicle-treated strains. The BOAT assays, antimicrobial vehicles, and the relative quantifications were performed as indicated in Figs. 1 and 2. All the data represent the average values obtained from three independent experiments. For the control vehicles of the antimicrobials see the legend in Fig. 2 and the “Methods” section. Asterisks above the boxplots represent the statistical significance (p value) as determined by Welch’s t test by comparing the median of each group with that of the respective control (Ctrl) group. Asterisk representation of statistical significance: *p ≤ 0.05; **p ≤ 0.01; ***p ≤ 0.001; ****p ≤ 0.0001.

