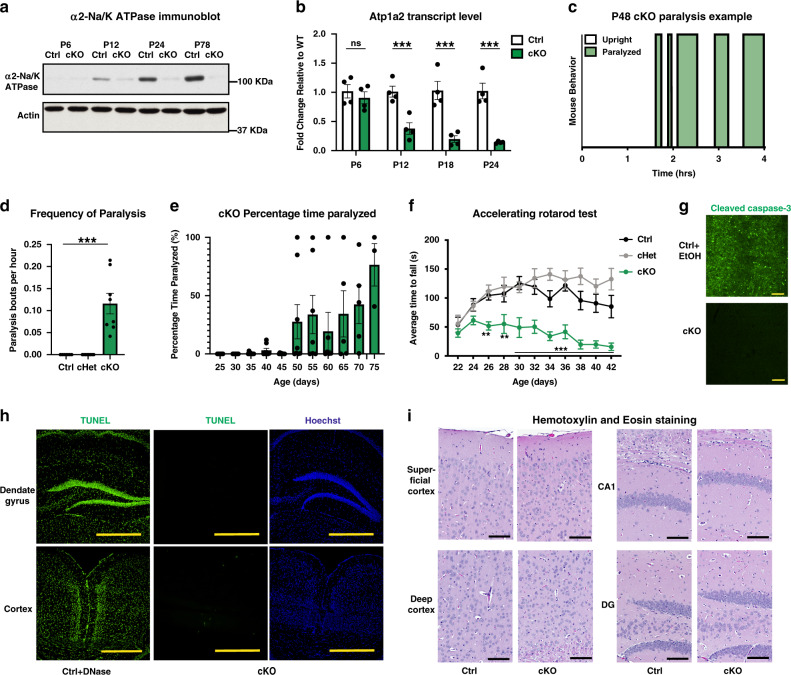
Fig. 1. Conditional α2-Na/K ATPase knockout mice display spontaneous transient paralysis.
a Lysates of the cerebral cortex from P6, P12, P24, and P78 conditional α2-Na/K ATPase knockout (cKO) and sex-matched littermate f/f or f/+ control (Ctrl) mice were immunoblotted with α2-Na/K ATPase and actin antibodies, the latter serving as loading control (n = 3 mice per group, quantification in Supplementary Fig. 2, full blots in Supplementary Fig. 15). b Lysates of the cerebral cortex from cKO or Ctrl mice at each age were subjected to qRT-PCR analyses using primers to α2-Na/K ATPase, normalized to Gapdh. Gapdh levels did not differ between groups (Supplementary Fig. 14a). Data are presented as mean ± s.e.m. ***P < 0.001 (two-way ANOVA followed by Fisher’s LSD post hoc test). c–e cKO, Ctrl, and conditional α2-Na/K ATPase heterozygous (cHet) mice were subjected to paralysis video monitoring. A representative trace from a P48 cKO mouse is shown (c). Shaded green regions represent paralysis. Quantification of video monitoring from conditional cKO, Ctrl, and cHet showing number of paralysis bouts (d). Note that no cHet/Ctrl mice ever exhibited an episode of paralysis. Data are presented as mean ± s.e.m. ***P < 0.001 (two-tailed t test, n = 7 Ctrl mice, 8 cHet mice, 8 cKO mice—3 male, 5 female, P = 0.0005). Quantification of video monitoring from cKO mice, showing total percentage time paralyzed (e). Data are presented as mean ± s.e.m. (n = 8 mice per group). f cKO, Ctrl, and cHet mice were subjected to an accelerating rotarod test. *P < 0.05, **P < 0.01, ***P < 0.001 (two-way ANOVA followed by Fisher’s LSD post hoc test comparing Ctrl and cKO, n = 6 mice per group—4 male, 2 female). g Representative images from cleaved caspase-3 staining from 50–75-day-old cKO and Ctrl mice. Sections from EtOH-injected Ctrl mice served as positive control. Scale bar is 100 µm; (n = 2). h Representative images of sections of the cerebral cortex from 50–75-day-old cKO and Ctrl mice subjected to TUNEL staining. DNase-treated Ctrl sections served as positive control. Scale bar is 500 µm; (n = 3). i Representative images from hematoxylin and eosin staining from 50–75-day-old cKO and Ctrl mice. Scale bar is 100 µm; (n = 3).

