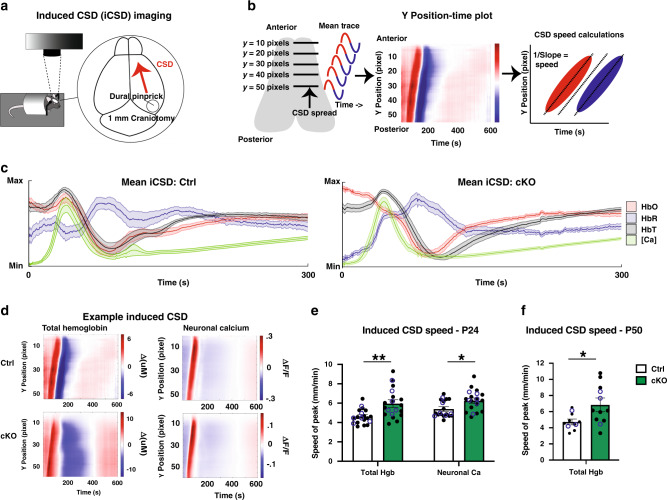
Fig. 2. Induced cortical spreading depression spreads faster in conditional α2-Na/K ATPase knockout mice.
a–e P24 conditional α2-Na/K ATPase knockout (cKO) and sex-matched littermate f/f or f/+ controls (Ctrl) mice expressing Thy1-GCaMP6f were anesthetized, subjected to a small craniotomy placed over the posterior right hemisphere and imaged for three trials after a pinprick of the dura. The average signal at each y point on the brain, for each point in time, is made into an image (position-time plot, (d)) where the image color represents the signal, y-axis represents the brain y-position and x-axis represents time (b). These images were used to calculate CSD speed. Traces illustrating mean ± s.e.m. for all included induced CSD trials (c). HbO oxygenated hemoglobin, HbR deoxygenated hemoglobin, HbT total hemoglobin, [Ca] neuronal calcium. Total time = 600 s; (n = 6 mice per group). Position-time plots of representative example CSD events from cKO and Ctrl animals (d). CSD peak spread significantly faster in the P24 cKO mice, in both the total hemoglobin and neuronal calcium traces (e). All iCSD position-time plots are shown in Supplementary Fig. 5 for P24. Filled in black circles represent speed for each CSD and statistics are calculated from this data, hollow blue circles represent the mean speed for each mouse. Data are presented as mean ± s.e.m. *P < 0.05, **P < 0.01 (two-tailed t test, n = 6 mice per group—3 female, 3 male and 14 CSDs in Ctrl, 15 CSDs in cKO, total Hgb = 4.61 ± 0.21 in Ctrl, 5.95 ± 0.40 in cKO, P = 0.030, neuronal Ca = 5.40 ± 0.24 in Ctrl, 6.25 ± 0.29 in cKO, P = 0.034). f CSD peak spread significantly faster in the hemoglobin trace for the P50 cKO mice. All iCSD position-time plots are shown in Supplementary Fig. 6 for P50. Filled in black circles represent speed for each CSD and statistics are calculated from this data, hollow blue circles represent the mean speed for each mouse. Data are presented as mean ± s.e.m. *P < 0.05 (two-tailed t test, n = 3 mice per group—2 female, 1 male and 8 CSDs in Ctrl, 9 CSDs in cKO, total Hgb = 4.74 ± 0.36 in Ctrl, 6.85 ± 0.86 in cKO, P = 0.047).

