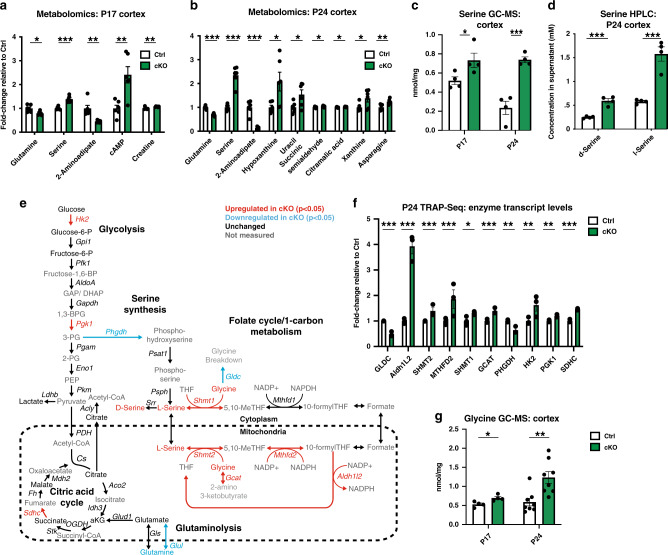
Fig. 5. Levels of serine and glycine are elevated in the cerebral cortex of conditional α2-Na/K ATPase knockout mice.
a Metabolomics was performed on flash-frozen cerebral cortex from P17 conditional α2-Na/K ATPase knockout (cKO) and sex-matched littermate f/f or f/+ control (Ctrl) mice. Only significantly altered metabolites are shown. Data are presented as mean ± s.e.m. *P < 0.05, **P < 0.01, ***P < 0.001 (two-tailed t test, n = 6 mice per group). b Metabolomics was performed on flash-frozen cerebral cortex from P24 cKO and Ctrl mice. Only significantly altered metabolites are shown. Data are presented as mean ± s.e.m. *P < 0.05, **P < 0.01, ***P < 0.001 (two-tailed t test, n = 6 mice per group). c The cerebral cortex from perfused P24 and P17 cKO and Ctrl mice was subjected to gas chromatography–mass spectrometry (GC–MS) for serine levels. The levels of serine were robustly elevated in the cerebral cortex of conditional α2-Na/K ATPase knockout mice. Data are presented as mean ± s.e.m. *P < 0.05, ***P < 0.001 (two-tailed t test, n = 4 mice per group, P = 0.046 P17, P = 0.00056 P24). d Flash-frozen cerebral cortex from P24 cKO and Ctrl mice was subjected to high-performance liquid chromatography (HPLC) to quantify levels of D- and L-serine. Data are presented as mean ± s.e.m. ***P < 0.001 (two-tailed t test, n = 4 mice per group, P = 0.00034 D-serine, P = 0.00058 L-serine). e Network constructed by integrating established metabolic pathways relevant to serine biosynthesis with TRAP-Seq data for transcript levels of metabolic enzymes and the metabolomics data for metabolite levels. Red indicates significant upregulation (P < 0.05), blue indicates significant downregulation, black indicates no significant change, and gray indicates an unmeasured metabolite. f Fold change of selected metabolic enzymes in the TRAP-Seq for cKO relative to Ctrl mice. Data are presented as mean ± s.e.m. *P < 0.05, **P < 0.01, ***P < 0.001 (false discovery rate (FDR), n = 3 mice per group). g The cerebral cortex from perfused P24 and P17 cKO and Ctrl mice was subjected to GC–MS for glycine levels. The levels of glycine were robustly elevated in the cerebral cortex of conditional α2-Na/K ATPase knockout mice. Data are presented as mean ± s.e.m. *P < 0.05, **P < 0.01 (two-tailed t test, n = 4 mice at P17, 8 at P24, P = 0.020 P17, P = 0.0035 P24).

