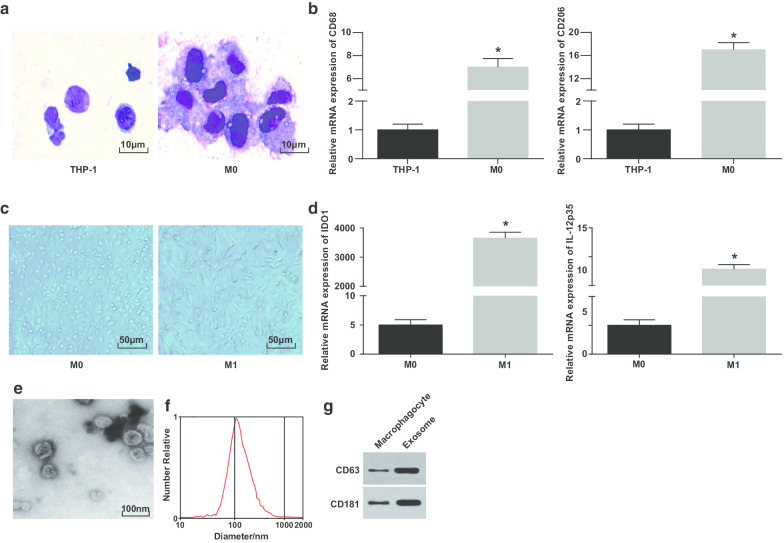
Fig. 1.
Identification of M1 macrophage and exosomes. a Wright’s staining for observing the morphology of THP-1 cells before and after PMA treatment. b CD68 and CD206 expression in THP-1 cells and PMA-treated THP-1 cells detected by RT-qPCR; c morphology of macrophages and M1 macrophages. d Expression of IDO1 and IL-12 p35 in M0 macrophages and LPS and INF-γ-treated M0 macrophages detected by RT-qPCR. e TEM for exosomes observation. f Detection of particle size distribution of exosomes by NTA. g Protein bands of CD63 and CD181. In panel b, *P < 0.05 versus THP-1 cells; In panel d, *P < 0.05 versus M0 macrophages. Measurement data were depicted as mean ± standard deviation (N = 3), comparisons between two groups were conducted by t test

