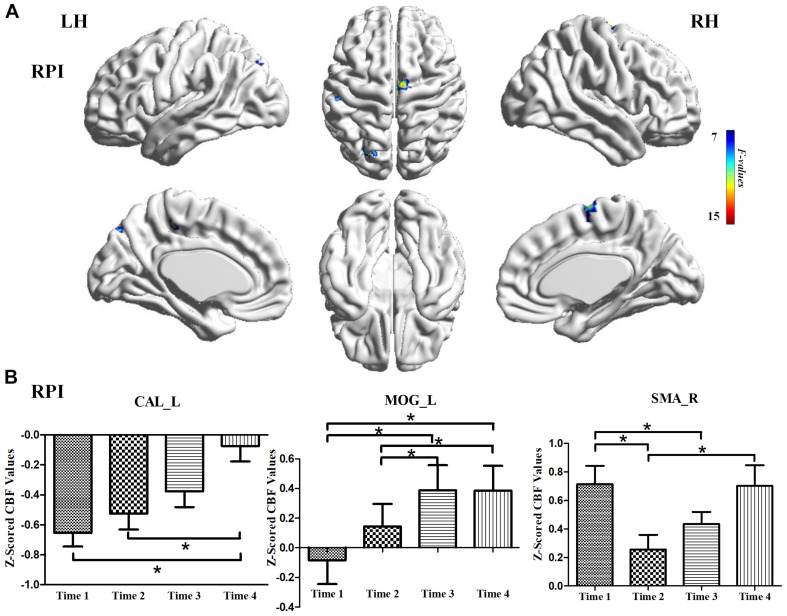
FIGURE 4.
CBF differences among different time-subgroups in the RPI group. (A) One-way repeated-measure ANOVA showed brain regions with CBF differences among different time-point subgroups in the CAL_L, MOG_L, and SMA_R. color bar indicated the F scores. (B) Bar plots showed the z-scored CBF values of these significant brain regions at four different time-subgroups and the change trends from the baseline stage to 6 months. CAL_L, the left calcarine sulcus; MOG_L, left middle occipital gyrus; SMA_R, right supplementary motor area; LH, left hemisphere; RH, right hemisphere; RPI, right pontine infarction. *P < 0.05.

