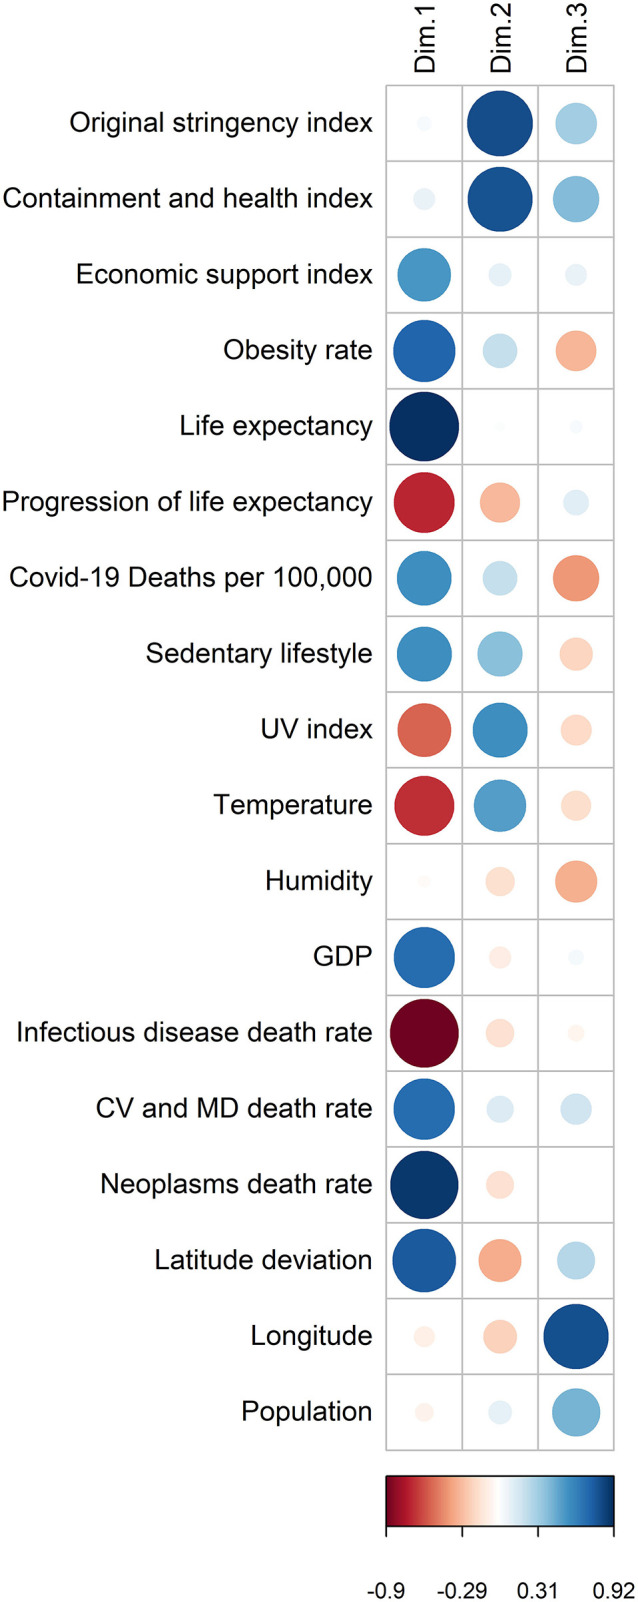
Figure 4.

Coordinates of the variables on the first 3 factorial axes. The larger the circle, the more the variable is correlated with the axis. A blue circle indicates that the variable is negatively correlated, a red circle indicates that the variable is positively correlated. The scale shows the coordinates of the variables on the axis.
