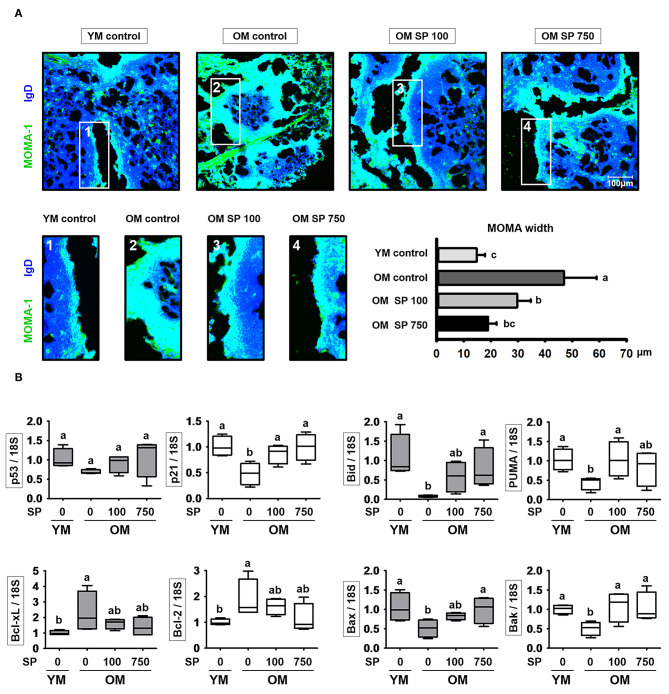
Figure 5.
SP regulates phenotypic changes in the MOMA-1 layer and affects expression of apoptosis-related genes in the lymph nodes. (A) Immunofluorescence analysis of spleen sections from the indicated samples. Two-color staining was performed using MOMA-1-FITC (green) and anti-mouse IgD-Violet 421 (blue) mAbs. Representative photos from each group are shown. The boxes drawn in white indicate the regions magnified in the boxes below, i.e., the MOMA band around the follicles. Scale bars = 100 μm. The graph depicts the thickness of the MOMA band (μm). Band width was calculated from four different measurements per band. (B) RNA was isolated from lymph nodes and quantitative RT-PCR analysis performed to assess expression of cell death-related genes (mean ± SEM; n = 4). Statistical significance was determined using one-way ANOVA followed by Tukey's post-hoc test. Datasets denoted by different letters are significantly different (p < 0.05).

