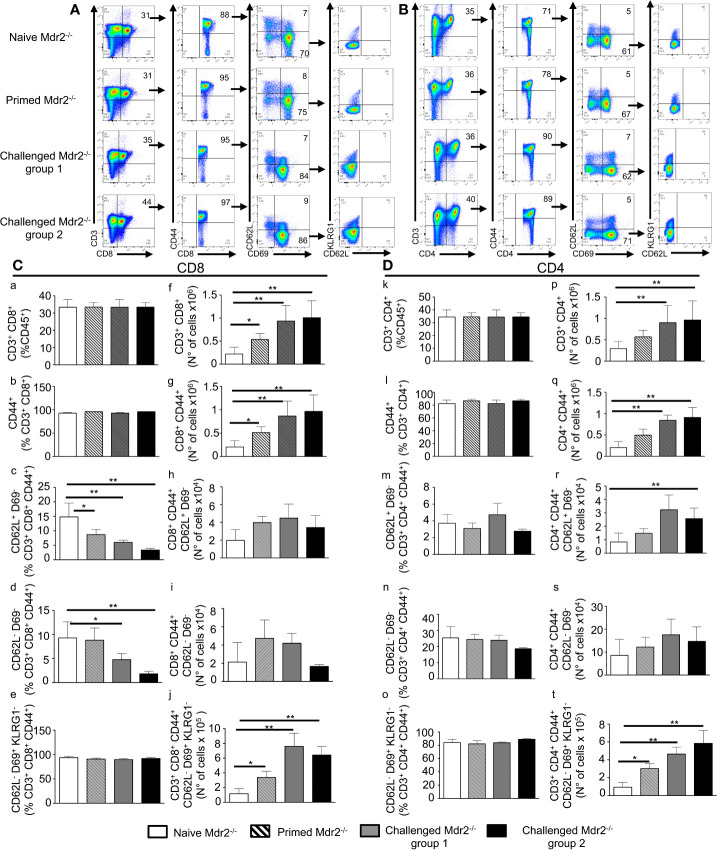
Figure 7.
Inoculation of SPZ in Mdr2−/− mice results in a CD8+ and CD4+ effector, central, and tissue resident memory T cell expansion. Six-week-old Female Mdr2−/− naïve mice, primed mice which received one single dose of 104 SPZ, and two challenged groups of mice which received two additional injections of 104 (group 1) and 105 SPZ (group 2) respectively, at 10 days interval (same protocol as in Supplementary Results: Figure 3 ), were sacrificed 90 days following the initial infection with PbANKA parasites (n = 6 per group). Among total liver leukocytes, CD8+ and CD4+ effector and central memory T cells were stained with the following markers: CD45, CD3, CD8, CD44, CD69, CD62L, and KLRG1. (A) Gating strategy for CD8 Tem (CD3+ CD8+ CD44hi CD69− CD62L−), Tcm (CD3+ CD8+ CD44hi CD69− CD62L+), and Trm (CD3+ CD8+ CD44hi CD69+ CD62L− KLRG1−) among CD45+ cells. (B) Gating strategy for CD4 Tem (CD3+ CD4+ CD44hi CD69− CD62L−) Tcm (CD3+ CD4+ CD44hi CD69− CD62L+), and Trm (CD3+ CD4+ CD44hi CD69+ CD62L− KLRG1-) among CD45+ cells. Counts of CD3+ CD8+ cells (C) and CD3+ CD4+ cells (D) analyzed by flow cytometry expressed as percentage (c–e, and k–o) of CD45+ cells and in absolute number of cells (f–j, and p–t). Counts of CD8+ CD44hi cells (C) and CD4+ CD44hi cells (D), analyzed by flow cytometry, were expressed as percentage (C b, D i) and absolute number of cells (C g, D q) of CD3+ CD8+ or CD3+ CD4+, respectively. Counts of CD69− CD62L−, and CD69− CD62L+ cells analyzed by flow cytometry expressed as percentage (c, d, and m, n) and absolute number (h, i, and r, s) of cells of CD3+ CD8+ CD44hi cells (C) or CD3+ CD4+ CD44hi (D). Counts of CD69+ CD62L− KLRG1- cells analyzed by flow cytometry expressed in percentage (e, o) and absolute number (j, t) of cells of CD3+ CD8+ CD44hi (C) or CD3+ CD4+ CD44hi cells (D). The asterisks indicate significant differences using the Mann–Whitney test (*p < 0.05; **p < 0.01). Shown data are representative of three independent experiments.

