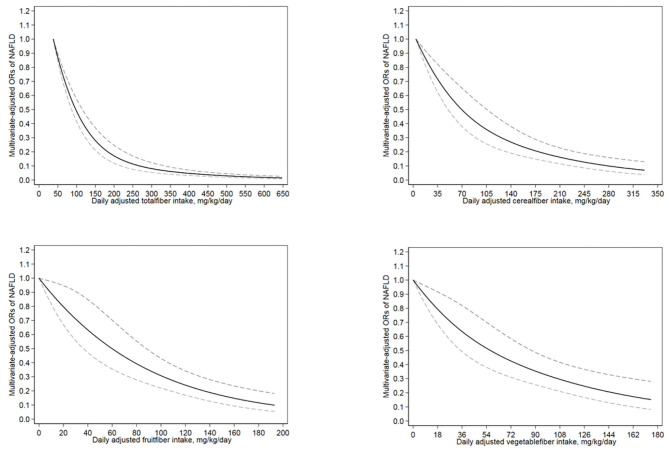
Figure 2.
The restricted cubic spline model showed a dose-response relationship between total, cereal, fruit and vegetable dietary fiber intake per kilogram of body weight per day and NAFLD. The lowest level of total fiber intake (38 mg/kg/day), cereal fiber intake (4 mg/kg/day), fruit fiber intake (0 mg/kg/day) and vegetable fiber intake (0 mg/kg/day) were used as the reference group, respectively. Adjustments were made according to age, sex, race, education level, smoking status, income level, hypertension, diabetes, vigorous recreational activity, average energy intake, UA and TC. The solid line and the dotted line represent the estimated OR and the corresponding 95%CI, respectively. OR, odds ratio.

