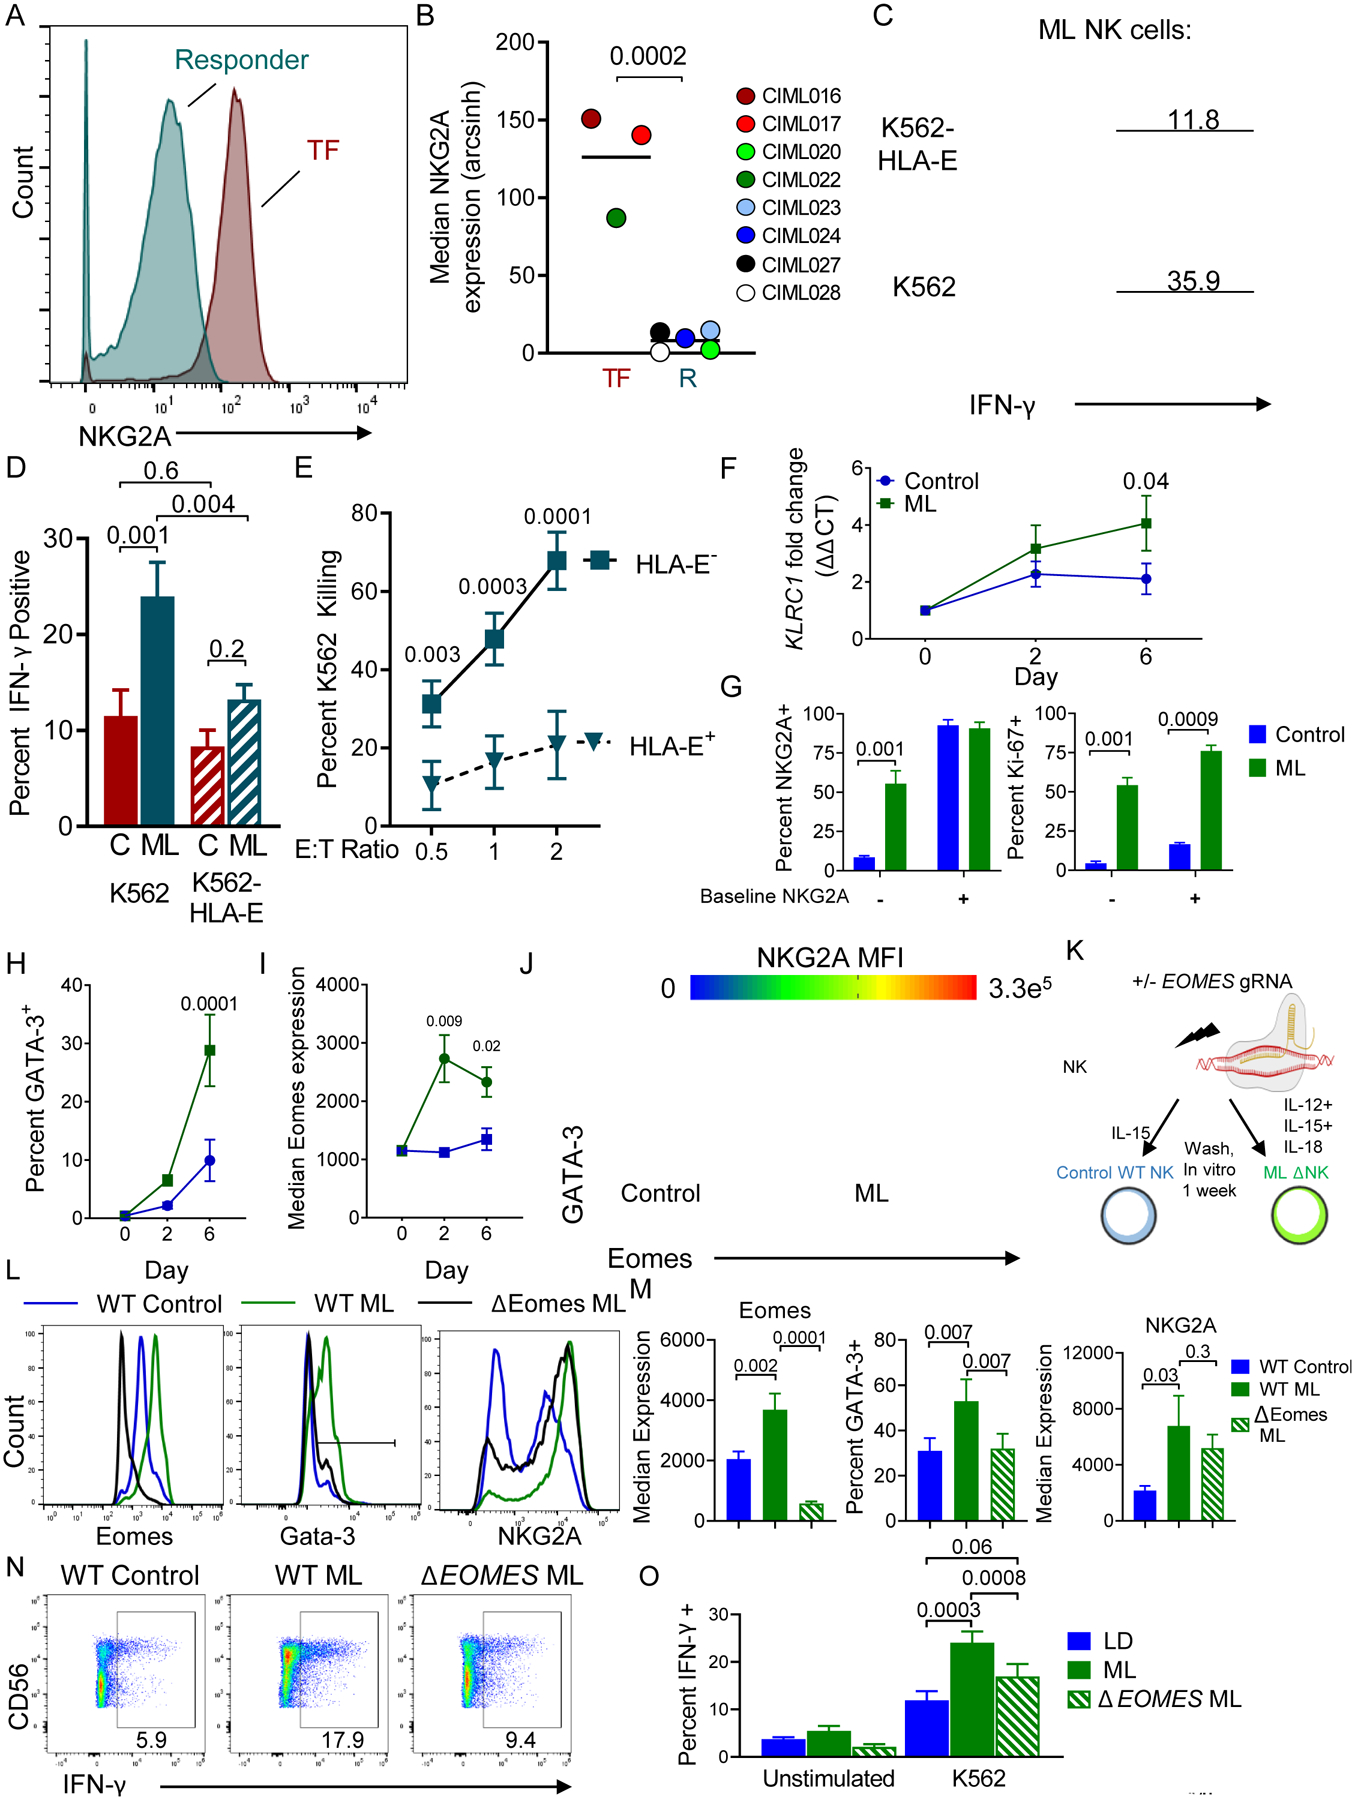
Fig. 5. Markedly increased NKG2A expression on ML NK cells within patient PBMC at day 7 is associated with treatment failure.

(A) Representative histogram of NKG2A expression on donor NK cells from a responder (R) or treatment-failure (TF) patient. (B) Summary data of median NKG2A expression on R v TF patients (n = 5 and 3, respectively). Data are shown with box-whiskers graph, with bars indicating min to max. Data were compared using Mann-Whitney test. (C-J) Control and memory-like NK cells were generated from normal donors in vitro and assessed. (C) Representative histograms showing IFN-γ expression by ML NK cells triggered with the indicated targets for 6 hours. Inset numbers depict percent IFN-γ+. (D) Summary showing the frequency of IFN-γ+ cells from ML and control (C) NK cells triggered with the indicated targets. Mean and SEM are shown, data were compared with RM-ANOVA with Holm-Sidak correction for multiple comparisons. (E) ML NK cell killing of K562 or HLA-E+ K562 tumor targets at the indicated effector to target (E:T) ratio. (F) qRT-PCR showing KLRC1 increases in ML NK cells compared to control cells. (G) Normal donor CD56dim CD16+ cells were flow sorted based on NKG2A expression. Control or ML NK cells were assessed at day 7 for NKG2A expression (left) and Ki-67 (right). Summary data from 4–5 normal donors from 2–3 independent experiments. Mean and SEM are depicted and data were compared using 2way ANOVA. (H) Flow cytometry data showing the percent GATA-3+ NK cells over time in control or ML NK cells. (I) Median Eomes expression data from control and ML NK cells. H-I data are mean and SEM, compared using 2way ANOVA with Sidaks correction. (J) Representative plot showing co-expression of GATA-3, Eomes, and colored by NKG2A Median fluorescence intensity (MFI). Gates enclose the GATA-3+Eomes+ NK cells. (K-O) Using CRISPR/Cas9, Eomes was deleted from NK cells prior to ML NK cell differentiation. Control, WT ML, and ΔEomes ML NK cells were generated in vitro and assessed after 7 days. (K) CRISPR/Cas9 Schema. (L) Representative histograms showing expression of indicated markers. (M) Summary from (L). (N-O) Representative flow plots showing IFN-γ production in response to K562 targets. Numbers represent the frequency of cells within the indicated gate. (O) Summary from (N). (L-O) Mean and SEM are displayed, data were compared using RM-ANOVA. N= 6 normal donors from 4 independent experiments, p-values are indicated within the graphs.
