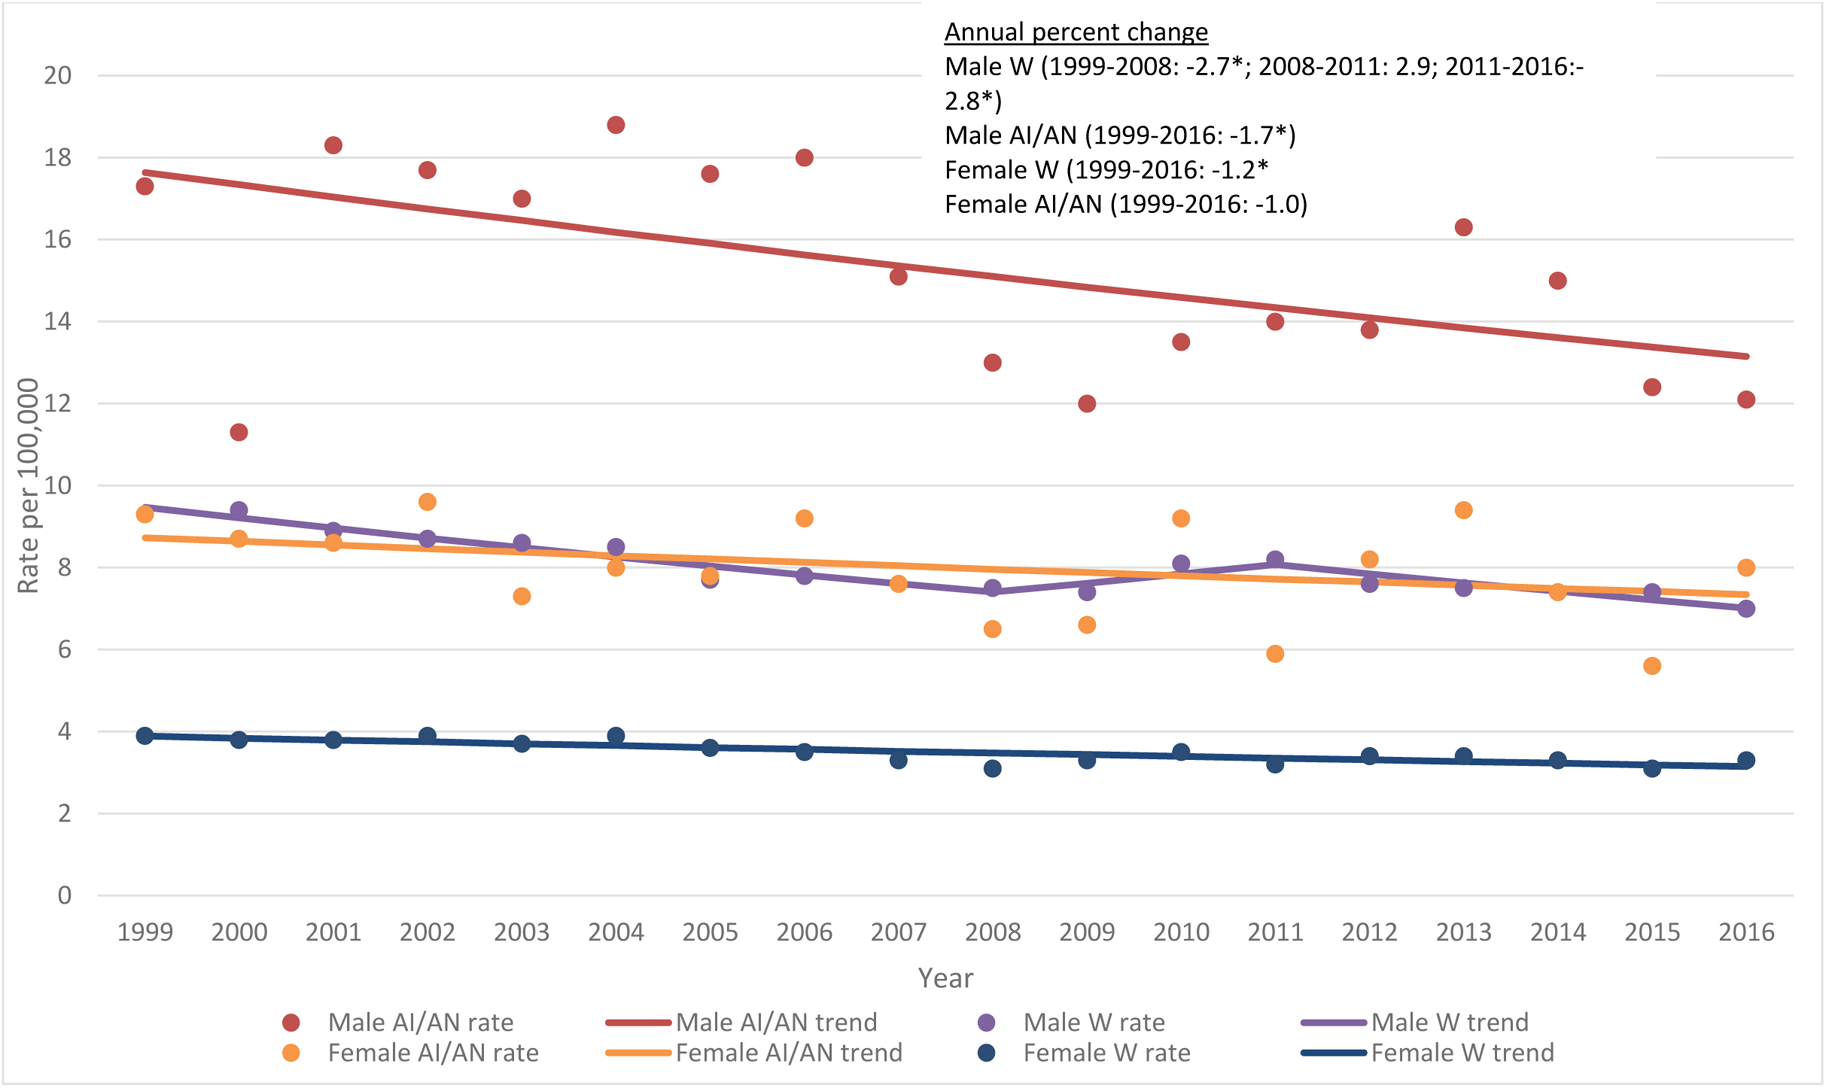
Figure 3.

Trends in gastric cancer incidence for American Indian/Alaska Native and white males and females, all regions, PRCDA counties, 1999–2016
Figure 3 contains four lines describing the gastric cancer incidence rates and trends between 1999—2016 for AI/AN males, AI/AN females, white males and white females. It also contains the average annual percent change in incidence rates for these groups.
Source: Cancer Registries in the National Program of Cancer Registries (NPCR) of the Centers for Disease Control and Prevention and the Surveillance, Epidemiology, and End Results (SEER) program of the National Cancer Institute
PRCDA Purchased/Referred Care Delivery Areas; IHS Indian Health Service; AI/AN; American Indian/Alaska Native; W; non-Hispanic white
a APC (Annual Percent Change) is based on rates that were age-adjusted to the 2000 US standard population (11 age groups, Census P25–1130).
* 2-sided P < 0.05
