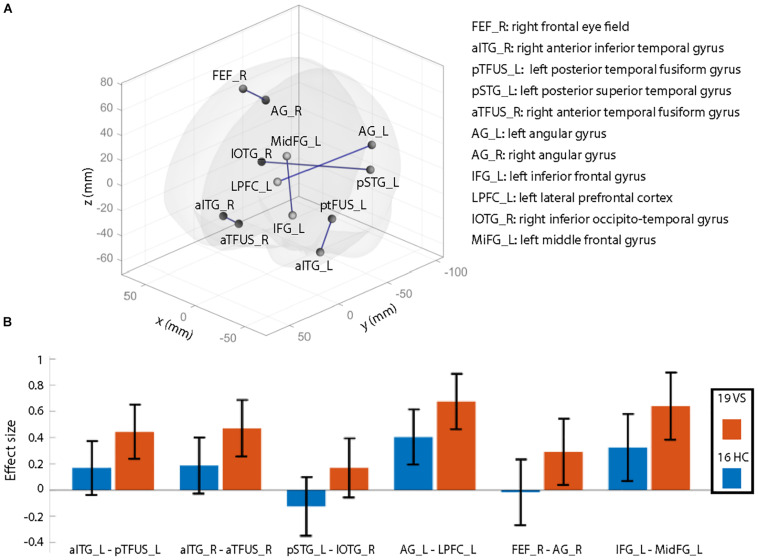
FIGURE 1.
Illustration of resting-state functional connectivity (rsFC) differences comparing healthy controls (HCs) to patients with visual snow (VS). (A) Patients with VS showed significantly increased rsFC (connections labeled in blue) compared to that in HCs. Results are shown at p < 0.05 (all t-values > 3.3), false discovery rate (FDR) seed level corrected (with additional correction for age and migraine occurrence). X, Y, and Z denote Montreal Neurological Institute (MNI) coordinates. (B) Effect sizes for both groups for significant rsFC between-group differences (∗p-values). These plots are shown for illustrative purposes only to demonstrate that the observed effects are mainly due to higher positive correlations in patients than in controls (i.e., they are not the result of weaker anticorrelations between regions). Abbreviations: atFUS, anterior temporal fusiform gyrus; pTFUS, posterior temporal fusiform gyrus; IOTG, inferior occipito-temporal gyrus; AG, angular gyrus; IFG, inferior frontal gyrus; aITG, anterior inferior frontal gyrus; IFG, inferior frontal gyrus; MidFG, middle frontal gyrus; FEF, frontal eye field; pSTG, posterior superior temporal gyrus; LPFC, lateral prefrontal cortex; L, left; R, right.

