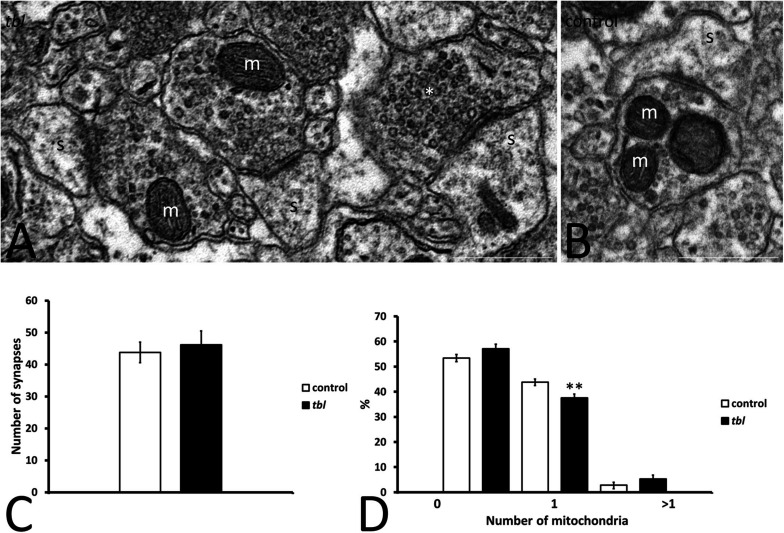
FIGURE 2.
Microphotographs of part of the mosaics of the control (B) and tbl (A) CA1 used for quantitative analyses illustrating axospinous synapses (s) without mitochondria in the presynaptic ending (A, asterisk), or those containing one (A, m) or more (B) mitochondria. No differences were found in the number of presynaptic terminals in the control and tbl CA1 (C, p = 0.6546196). The only statistically difference found was in the number of presynaptic endings with one mitochondrion, which was lower in the tbl than in the control CA1 (D, **p = 0.0073196): s, postsynaptic dendritic spine. Bars = 0.5 μm (A,B).

