FIGURE 3.
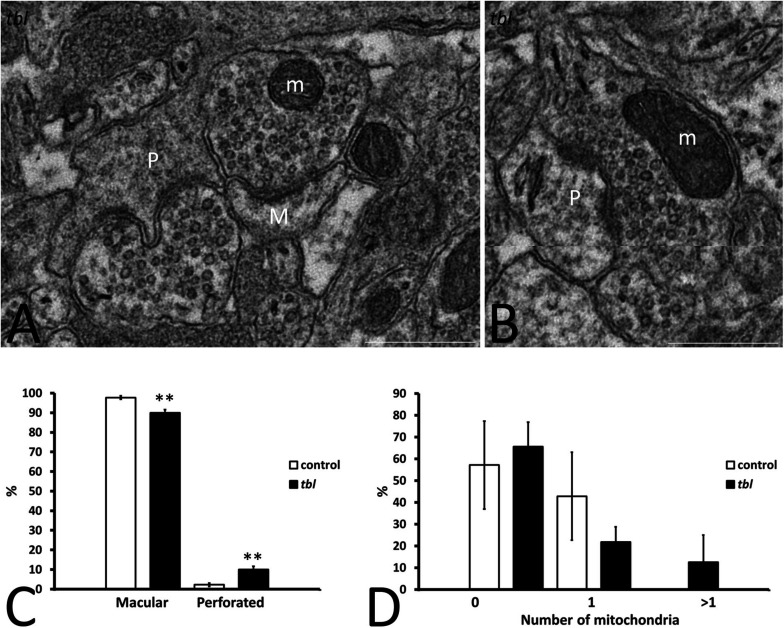
Microphotographs of part of the mosaics of the tbl CA1 used for the quantitative analyses of axospinous synapses (A,B). A illustrates the criteria followed to assess the perforated (P) and non-perforated or macular (M) postsynaptic regions of axospinous synapses. Panel (B) shows a perforated synapse (P) whose presynaptic ending contains healthy mitochondria (m). Macular axospinous synapses were the most numerous in the control CA1 neuropil than in the tbl one (C, **p = 0.00202), while there were fewer perforated ones in the control CA1 neuropil than in tbl mice (C, **p = 0.00202). No significant differences were found in the number of perforated synapses with (D, 1 and >1) or without (D, 0) mitochondria within their presynaptic endings between the control and tbl CA1 neuropil (D, 0; p = 0.7218734; D, 1; p = 0.358118; D, >1; p = 0.350616). Bar = 0.5 μm (A,B).

