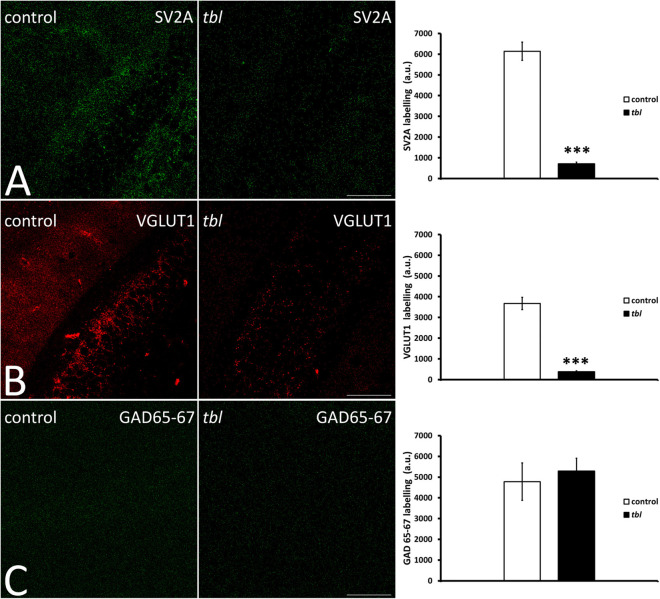
FIGURE 7.
Laser confocal microphotographs (A–C) of coronal sections through the CA1 field of the hippocampus. (A–C) Z stacks of 9 slices (0.5 μm thick) illustrating the distribution of SV2A (A), VGLUT1 (B), and GAD 65–67 (C) immunoreactive synaptic vesicles in the control and tbl mice. Graphs showing the number of synaptic vesicles identified by SV2A immunoreactivity (A), the synaptic glutamatergic vesicles identified by VGLUT1 expression (B), and the GABAergic endings identified with the GAD 65–67 antibody (C). The tbl CA1 possesses significantly fewer vesicles expressing SV2A (A, ***p = 4.0179E–14) and VGLUT1 (B, ***p = 1.68366E–12) as presynaptic markers, while no difference was found in GAD 65-67 expression (C, p = 0.3280439). Bar = 100 μm (A–C).

