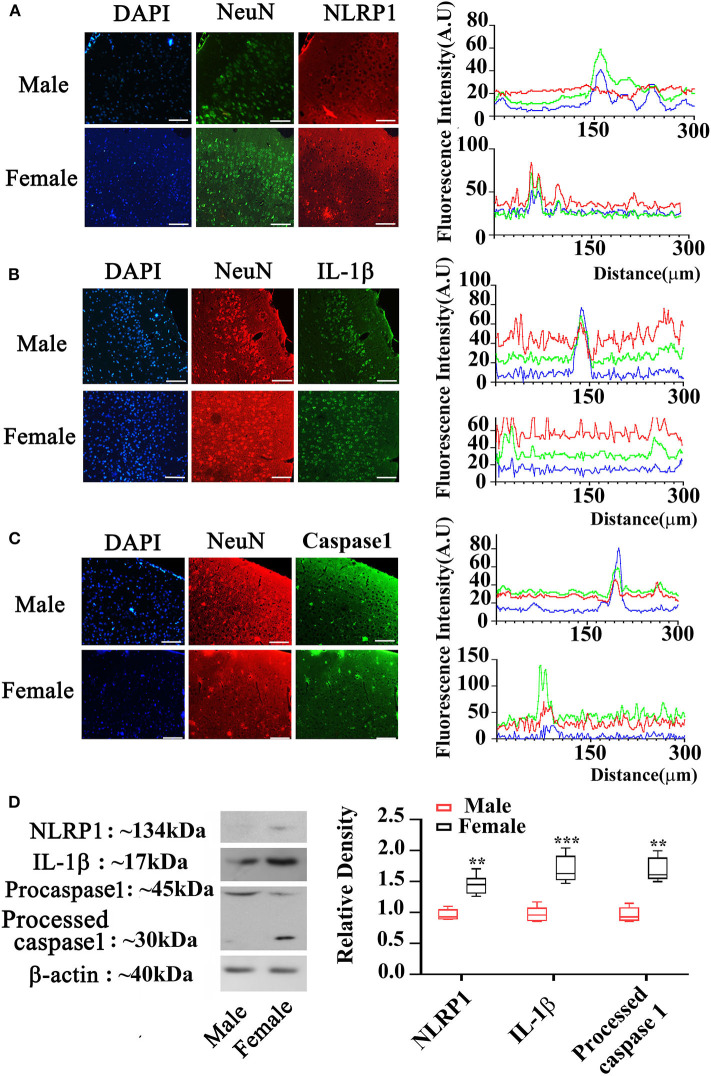
Figure 2.
Expression of NLRP1 signaling in cortex of male and female APP/PS1+/− mice. (A–C) Immunostaining showing NLRP1, IL-1β, and Caspase 1 expression in the cortex of male and female APP/PS1+/− mice; and the blue, red and green fluorescence in the right panel are for DAPI, NeuN, and IL-1β, respectively; (D) Western-blotting staining showing NLRP1, IL-1β, and Caspase 1 expression in cortex of male and female APP/PS1+/− mice (the line in each box in the right panel indicating means). **P < 0.01 and ***P < 0.001 vs. male mice. The sale bar = 50 μm in low magnification images. n = 8–10. The sale bar = 20 μm in insert images.

