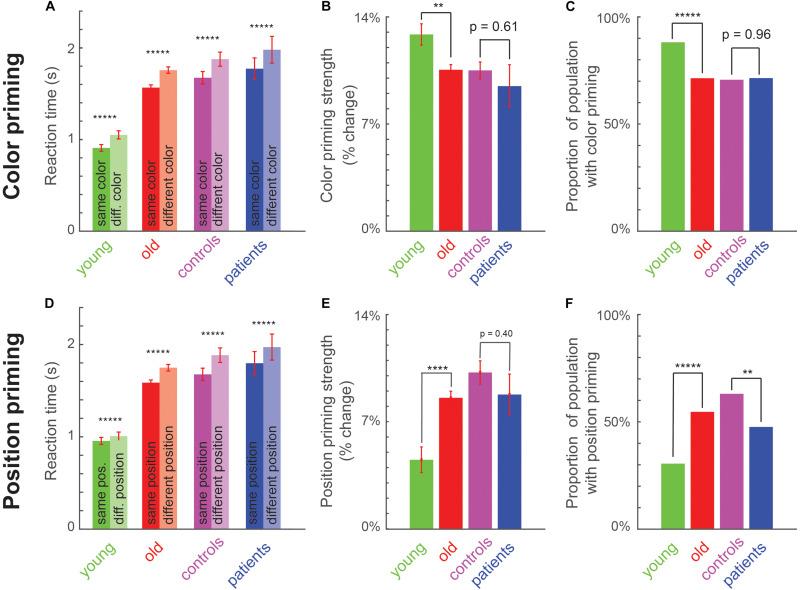
FIGURE 2.
Perceptual priming effects across age and cognitive impairments. (A) Average reaction time for same-color (dark) and different-color (light) trials across young, old, matched controls (am old) and patients. Asterisks indicate statistical significance of the main effect of color in an ANOVA (Supplementary Section S2): * is p < 0.05, ** is p < 0.005, etc., Error bars indicate SEM across participants. (B) Color priming strength across groups. Asterisks indicate statistical significance comparing priming strength across participants between groups, using a rank-sum test (*p < 0.05, **p < 0.005, etc.). Error bars indicate SEM across participants. (C) Proportion of population with significant color priming shown for each group of participants. Asterisks indicate statistical significance comparing the rate of incidence between each pair of groups, using a chi-squared test, with conventions as before. (D–F) Same as (A–C) but for position priming.

