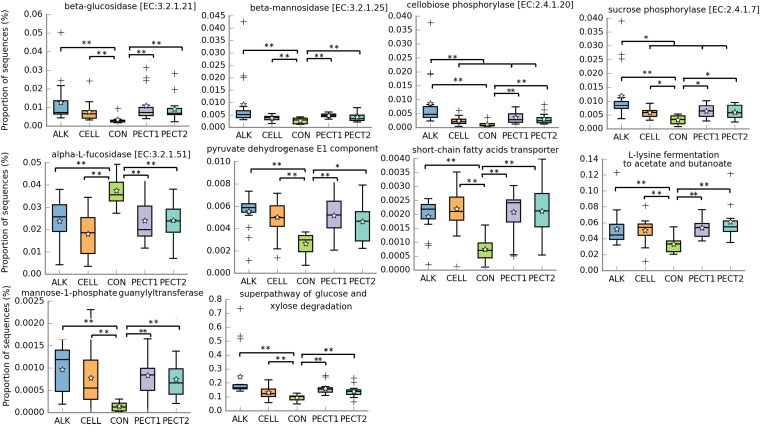
FIGURE 5.
Significantly different metagenomic functions in relative abundance among ALK, CELL, CON, PECT1, and PECT2. The predicted abundances of microbial functional profile in pre-treated RSM compared to CON were analyzed by ANCOVA. *P < 0.05; **P < 0.01. The stars represent the group means while the middle bars of the boxplots represent the median and the plusses represent outliers.

