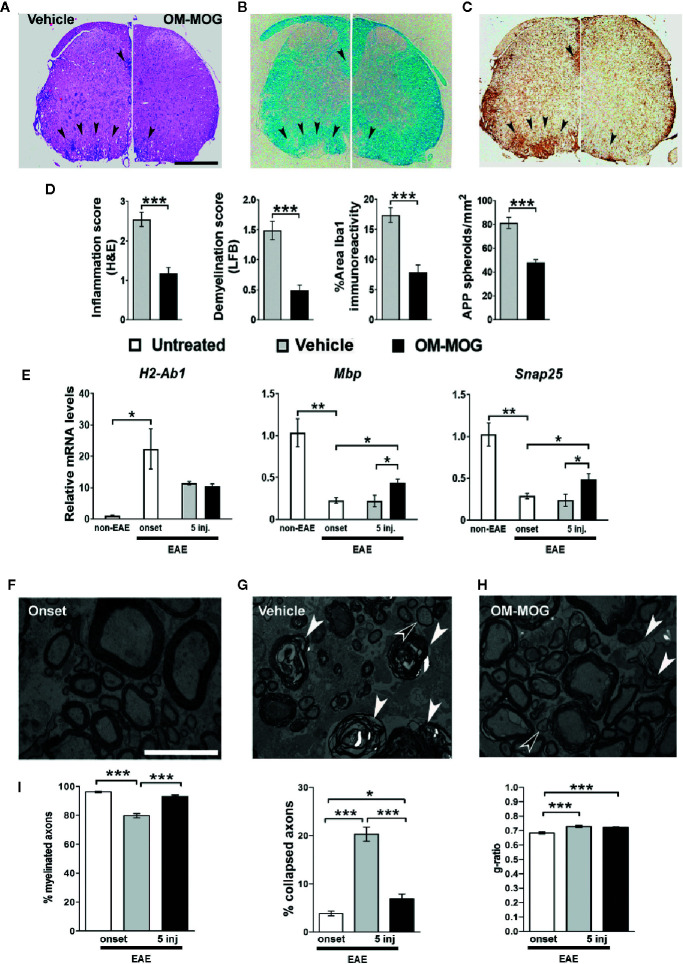
Figure 3.
Therapeutic OM-MOG reverses spinal cord neuropathology in DR2b.Ab° mice, and increases the expression of myelin and neuronal genes, and preserves axons in B6 mice during MOG-EAE. (A–D) Neuropathological analysis of spinal cord sections from therapeutic vehicle- (left panels of each photo) and OM-MOG-injected (right panels of each photo) DR2b.Ab° mice on dpi 20 for EAE. (A, D) Inflammatory cell infiltration was measured by H&E; (B, D) demyelination by LFB; (C, D) microgliosis by Iba1 immunostaining; (D) axon damage by amyloid precursor protein (APP) immunostaining. Vehicle-treated control mice show large confluent inflammatory, demyelinating lesions with neuroinflammation typical of MOG-EAE (arrowheads). OM-MOG-treated mice showed markedly reduced spinal cord pathology. Representative sections from 1 of 5 (OM-MOG) or 4 (vehicle) mice per group are shown. Scale bar 500 μM. (E) Quantitative RT-PCR analysis of mRNA levels for selected markers, H2-Ab1 (inflammation), Mbp (myelin) and Snap25 (neurons), relative to Gusb, in whole spinal cord recovered from B6 mice before immunization for MOG-EAE (non-EAE, n=4) or during MOG-EAE on the day of the first clinical symptom (onset, n=4) and after 5 injections of vehicle (n=5; for H2-Ab1, n=4) or OM-MOG (n=5; for H2-Ab1 n=4). (F–H) Representative electron micrographs of anterior funiculus of lumbar spinal cord, a major site of inflammatory lesions, from B6 EAE mice before treatment (clinical score 2, “onset”) (F), or after 5 i.d. injections of vehicle (G) or OM-MOG (H). White arrowheads show collapsed axons, black arrowheads show remyelinated axons, scale bar 5 μM. (I) Percentages of non-collapsed myelinated axons (left graph) and collapsed axons (middle graph), and quantification of the g-ratios (axon diameter/fiber diameter) of myelinated axons (right graph) in the same groups of mice shown in (F–H) (n=3 per group). Therapeutic effects of OM-MOG at the clinical level were seen in one (DR2b.Ab° mice) or more (B6) independent ËAE experiments. Data and statistical significance for each analysis are derived from one experiment each, after pairwise comparisons between samples from different mouse groups using Student’s t test (D, E), Kruskal-Wallis test (I, axon measurements) or one-way ANOVA (I, g-ratios) (*p ≤ 0.05, **p ≤ 0.01 ***p ≤ 0.001).

