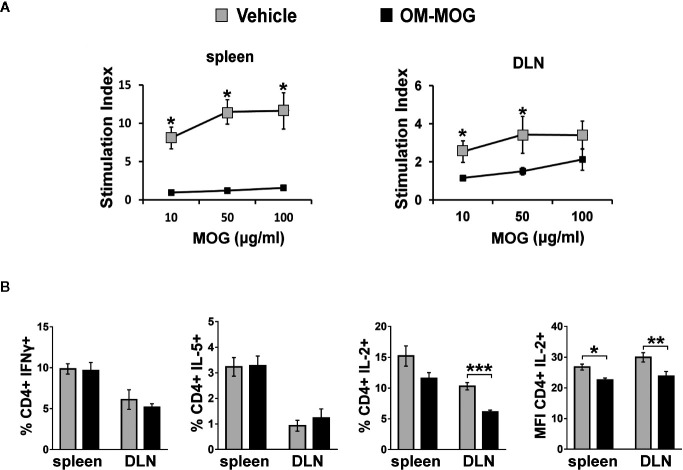
Figure 4.
OM-MOG tolerized T cells in DR2b.Ab° mice show impaired myelin oligodendrocyte glycoprotein (MOG)-specific proliferation responses and IL-2 production. (A) Proliferation of splenocytes and draining lymph node (DLN) cells isolated from prophylactic DR2b.Ab° mice dpi 13 with MOG/CFA (n=5 per group). Cells were stimulated in vitro with MOG and thymidine incorporation was measured. (B) FACS of CD4+ T cells among splenocytes and DLN cells isolated from prophylactic DR2b.Ab° mice dpi 13 with MOG/CFA, for production of IFN-γ, IL-5 and IL-2, measured by intracellular cytokine staining (n=5 per group). Data and statistical significance are derived from one (IL-5), or one representative of three independent experiments. Statistical significance after pair-wise comparisons between cells from different mouse groups using Student’s t test is shown (*p ≤ 0.05, **p ≤ 0.01, ***p ≤ 0.001).

