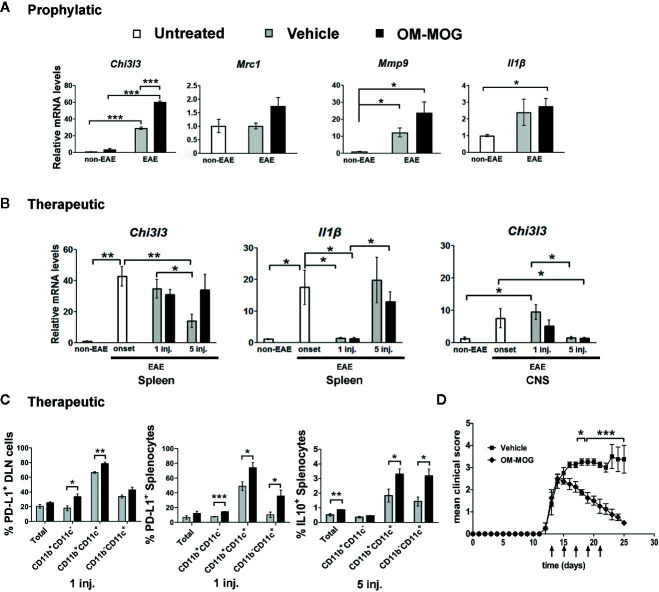
Figure 7.
OM-MOG induces a peripheral type 2 myeloid cell response during experimental autoimmune encephalomyelitis (EAE). (A) Quantitative RT-PCR analysis of mRNA levels for Chi3l3, Mrc1, Mmp9, and Il1β in spleen recovered from B6 mice after prophylactic injections of OM-MOG or vehicle (Chi3l3) or from naïve B6 mice (Mrc1, Mmp9, and Il1β) before EAE (non-EAE) and from B6 mice after prophylactic injections of OM-MOG or vehicle dpi 18 after immunization with MOG/CFA/PTx for induction of MOG-EAE (n=3 per group). (B) Quantitative RT-PCR analysis of mRNA levels for Chi3l3 and Il1β in spleen and spinal cord recovered from naïve (non-EAE) B6 mice or MOG-EAE B6 mice at different time points before (at clinical score 2, “onset”) or after 1 and 5 therapeutic injections of OM-MOG or vehicle (n=4 per group). (C) Flow cytometry of CD11b+ and CD11c+ myeloid cells among splenocytes and draining lymph node (DLN) recovered from MOG-EAE B6 mice after one and five therapeutic injections of OM-MOG or vehicle, dpi 14 and 25 respectively, for cell surface PD-L1 (left and middle graphs) or intracellular IL-10 production (right graph) (n=4 OM-MOG, n=3 vehicle). (D) Mean clinical scores of MOG-EAE in B6 mice injected i.d. with OM-MOG or vehicle at indicated time points (arrows), scored for the entire duration of experiment and analyzed in (C). Data are from one (A–C, IL-10) or one representative of two (C, PD-L1; D) experiments. Statistical significance after multiple comparisons between groups using Student’s t test (A–C) or two way ANOVA (D) is shown (*p ≤ 0.05, **p ≤ 0.01, ***p ≤ 0.001).

