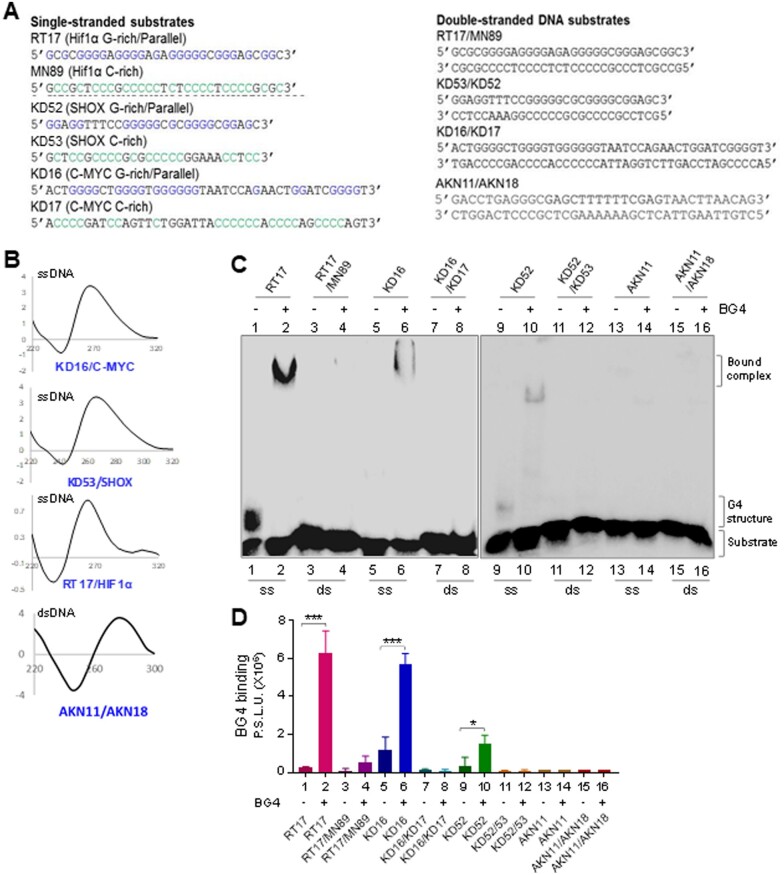
Figure 3.
Assessment of BG4 binding to different single-stranded and double-stranded DNA. (A) Sequences of DNA substrates (single-stranded, double-stranded) used for binding studies. (B) CD spectra were recorded for G4-forming sequences in presence of 100 mM KCl, and for B-DNA duplex, at room temperature, within wavelength range of 220–300 nm (10 cycles), using a spectropolarimeter (JASCO J-810) at scan speed of 50 nm/min. Absorption spectrum measured for buffer alone (15 cycles) was subtracted from each sample and resulting spectra were plotted. KD16 (c-MYC), KD53 (SHOX) and RT17 (HIF1α) showed a parallel orientation with a negative dip at 240 nm and a positive peak at ∼270 nm. In all cases ‘X’-axis denotes wavelength (nm) and ‘Y’-axis denotes molar ellipticity (mdeg). (C) Comparison of BG4-binding efficiency between single-stranded DNA containing G4 structures, RT17 (Hif1α; lanes 1, 2), KD16 (c-MYC; lanes 5, 6), KD52 (SHOX; lanes 9, 10), random DNA (AKN11) and double-stranded DNA containing G4 motifs, RT17/MN89 (Hif1α; lanes 3, 4), KD16/KD17 (c-MYC; lanes 7, 8), KD52/53 (SHOX; lanes 11, 12) and B-DNA duplex (AKN11/18). In all cases, BG4 (1.3 µg) was incubated with ssDNA or dsDNA and bound complexes were resolved on a 6% native PAGE. (D). Bar diagram showing BG4 binding across single-stranded and double-stranded DNA substrates derived from Hif1α, c-MYC and SHOX. Y-axis denotes radioactivity intensity depicting the BG4-bound complexes.

