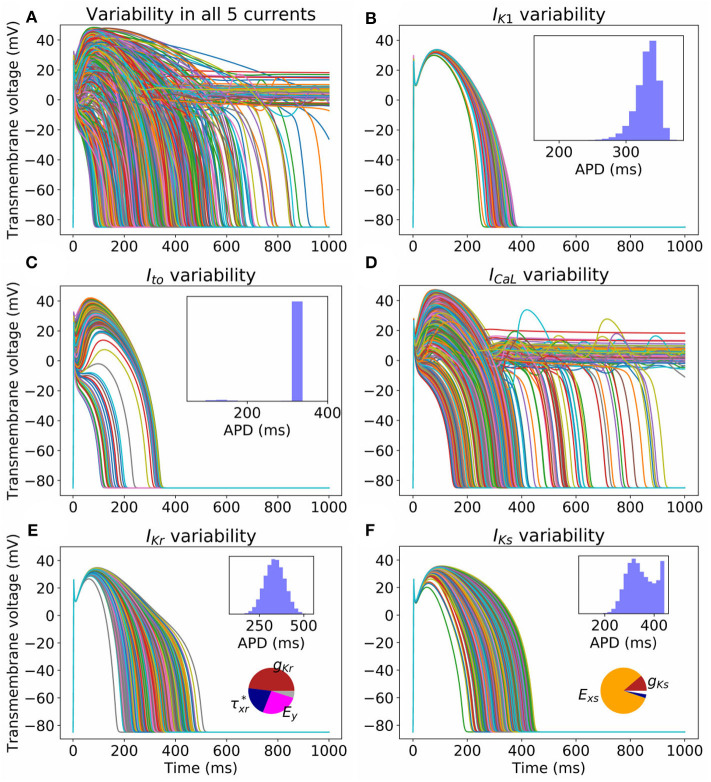
Figure 2.
Impact on action potential of uncertainty (due to population variability, derived from experimental data) in all (A) or individual currents (B–F). Each figure displays 1,000 sample action potentials, together with APD histograms (N = 100, 000). Pie charts show first-order Sobol sensitivity indices.

