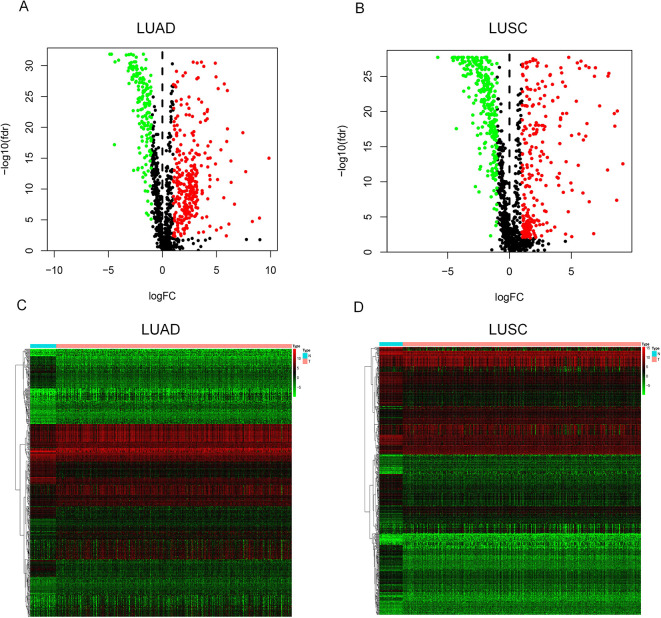
Figure 2.
The volcano plot and heatmap of differentially expressed immune genes. In the volcano plot, red points represent up-regulated genes (logFC > 1 and adj. P < 0.01) and green points represent down-regulated genes (logFC < -1 and adj. P < 0.01), while black points indicate genes without significant differential expression (|logFC| < 1 or adj. P > 0.01). In the heatmap, genes with higher expression are shown in red and genes with lower expression are shown in green, while genes with the same expression level are in black. (A) Volcano plot for LUAD; (B) Volcano plot for LUSC; (C) Heatmap for LUAD; (D) Heatmap for LUSC.

