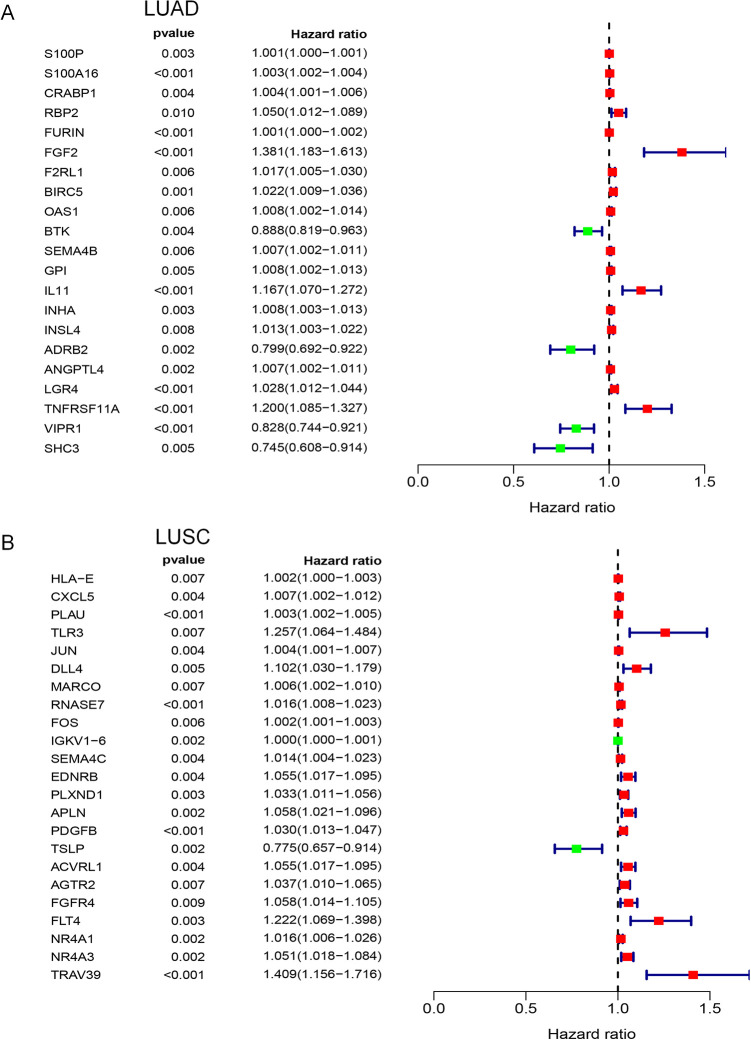
Figure 3.
Forest plots of univariate Cox regression analysis. In forest plots, the vertical dotted line represents hazard ratio (HR) = 1; the green box represents HR < 1.0, which indicated that the immune gene was a favorable prognostic biomarker; Conversely, red box represents HR > 1.0, which identified the immune gene as a poor prognostic indicator. The length of the horizontal line represents the 95% confidence interval for each immune gene. (A) Forest plot for LUAD; (B) Forest plot for LUSC.

