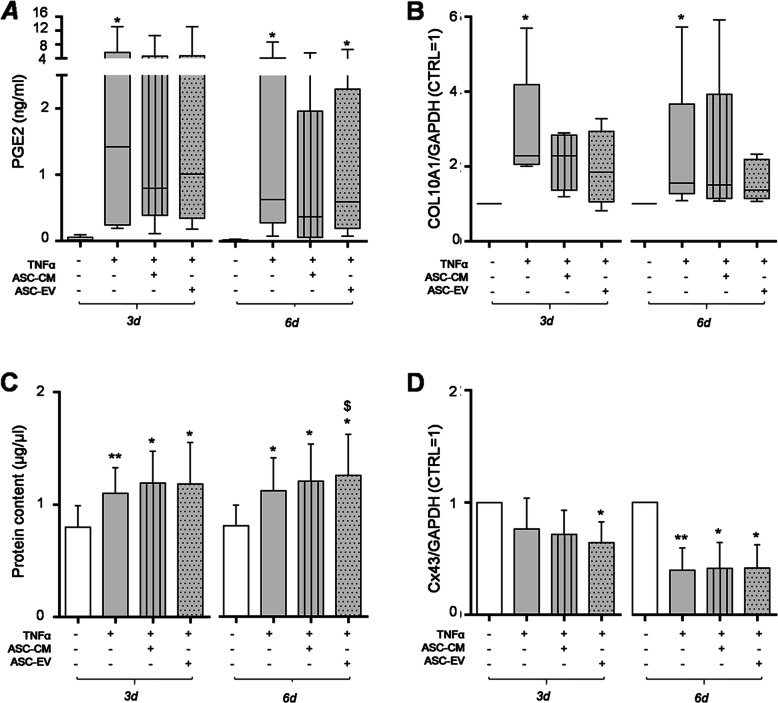
Fig. 3.
Hypertrophy and inflammatory markers induced by TNFα treatment. a PGE2 levels, quantified in CH culture medium at day 3 and 6 after treatments, are expressed as ng/ml (n = 6 independent experiments). b COL10A1 expression by Western blot analysis. Data (n = 5 independent experiments) were normalized on GAPDH and shown as relative values (CTRL = 1). Data in a and b were analyzed by Friedman’s test followed by Dunn’s multiple comparison test and significance vs CTRL is shown as *p < .05. For each column, the box extends from the 25th to 75th percentiles, the line in the middle is plotted at the median while the whiskers indicate minimum and maximum value. c CH protein concentration at day 3 and 6 (left and right panel, respectively). Significance vs CTRL is shown as *p < .05 and **p < .01; vs 10 ng/ml TNFα as $p < .05 (n = 7 independent experiments). d Cx43 expression by Western blot. Data (n = 5 independent experiments) were normalized on GAPDH and expressed as relative values (CTRL = 1). Significance vs CTRL is shown as *p < .05 and **p < .01

