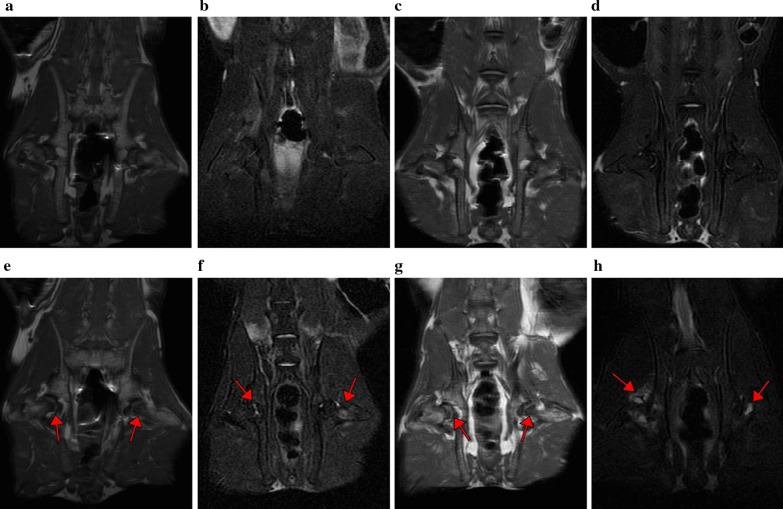
Fig. 1.
MRI. a and b were T1WI and T2WI + fat-suppression coronal image in the control group; c and d were T1WI and T2WI + fat-suppressed coronal image at 2nd week after injection of hormone in the model group; e and f were T1WI and T2WI + fat-suppressed coronal image at 4th week after injection of hormone in the model group; g and h were T1WI and T2WI + fat-suppressed coronal image at 6th week after injection of hormone in the model group. (Red arrows indicated osteonecrosis low/high signal in T1WI and T2WI + fat suppression sequences)

