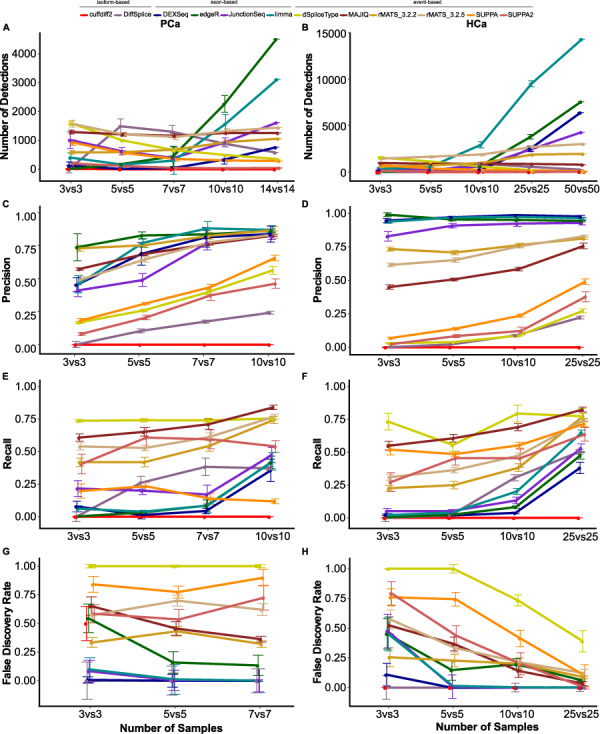
Figure 2.

Median and standard error of the number of detections, precision, recall and FDR of the 10 compared methods in PCa and HCa data sets with different numbers of replicates. Number of DS genes in the (A) PCa and (B) HCa data set. Precision in the (C) PCa and (D) HCa data set. Recall in the (E) PCa and (F) HCa data set. FDR in the (G) PCa and (H) HCa data set. The points and error bars correspond to the median and the standard error of the 10 randomly sampled subsets for the different numbers of replicates.
