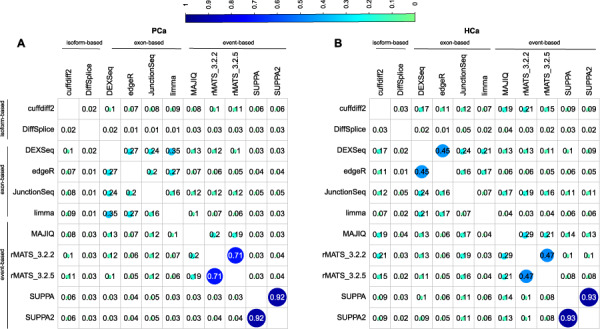
Figure 3.

Similarity between the methods in the complete PCa and HCa data sets. Overlap of top 500 ranked DS genes between the methods in the (A) PCa and (B) HCa data set. Genes were ranked based on the FDR in all methods except for DiffSplice, which provided its own test statistic to rank the genes instead. dSpliceType was excluded from this comparison as it allowed listing genes only until FDR of 0.05 which provided less than 500 genes in both data sets.
