Figure 4.

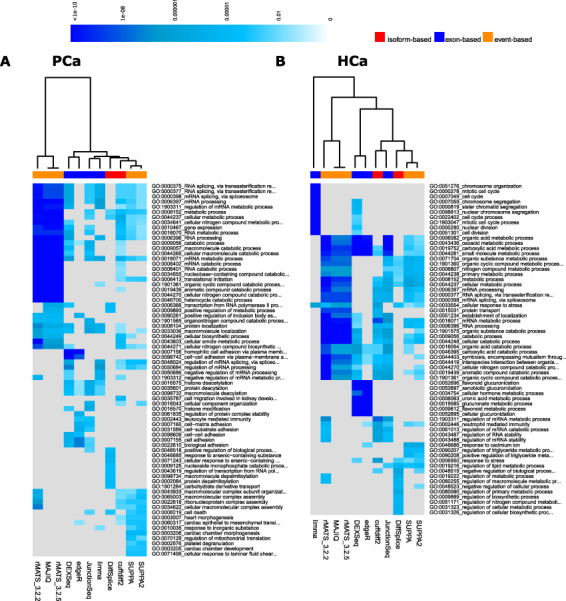
Heatmap of the P-values of the top enriched GO biological processes across the methods in the complete (A) PCa and (B) HCa data sets. Grey colour represents missing values.

Heatmap of the P-values of the top enriched GO biological processes across the methods in the complete (A) PCa and (B) HCa data sets. Grey colour represents missing values.