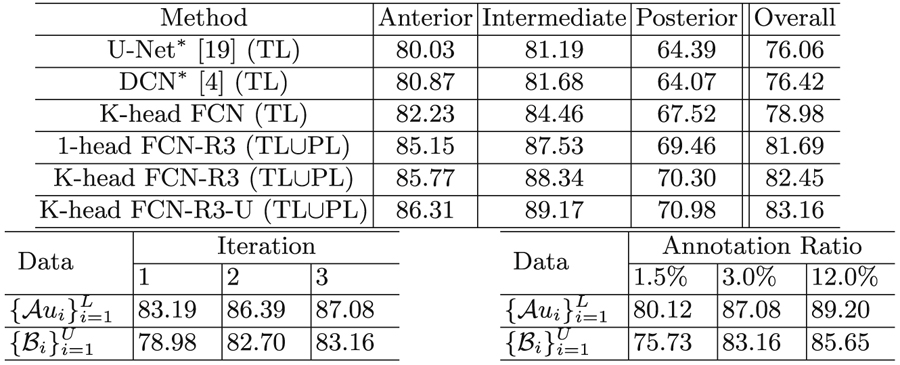
Table 1.
Segmentation results. Top: DSC (%) comparison of cartilages in the anterior, intermediate, and posterior skull, w/annotation ratio of 3.0%. TL: true labels; PL: pseudo labels. Bottom-left: “K-head FCN-R3-U (TL∪PL)” w/annotation ratio of 3.0%. Bottom-right: “K-head FCN-R3-U (TL∪PL)” w/different annotation ratios.
 |
