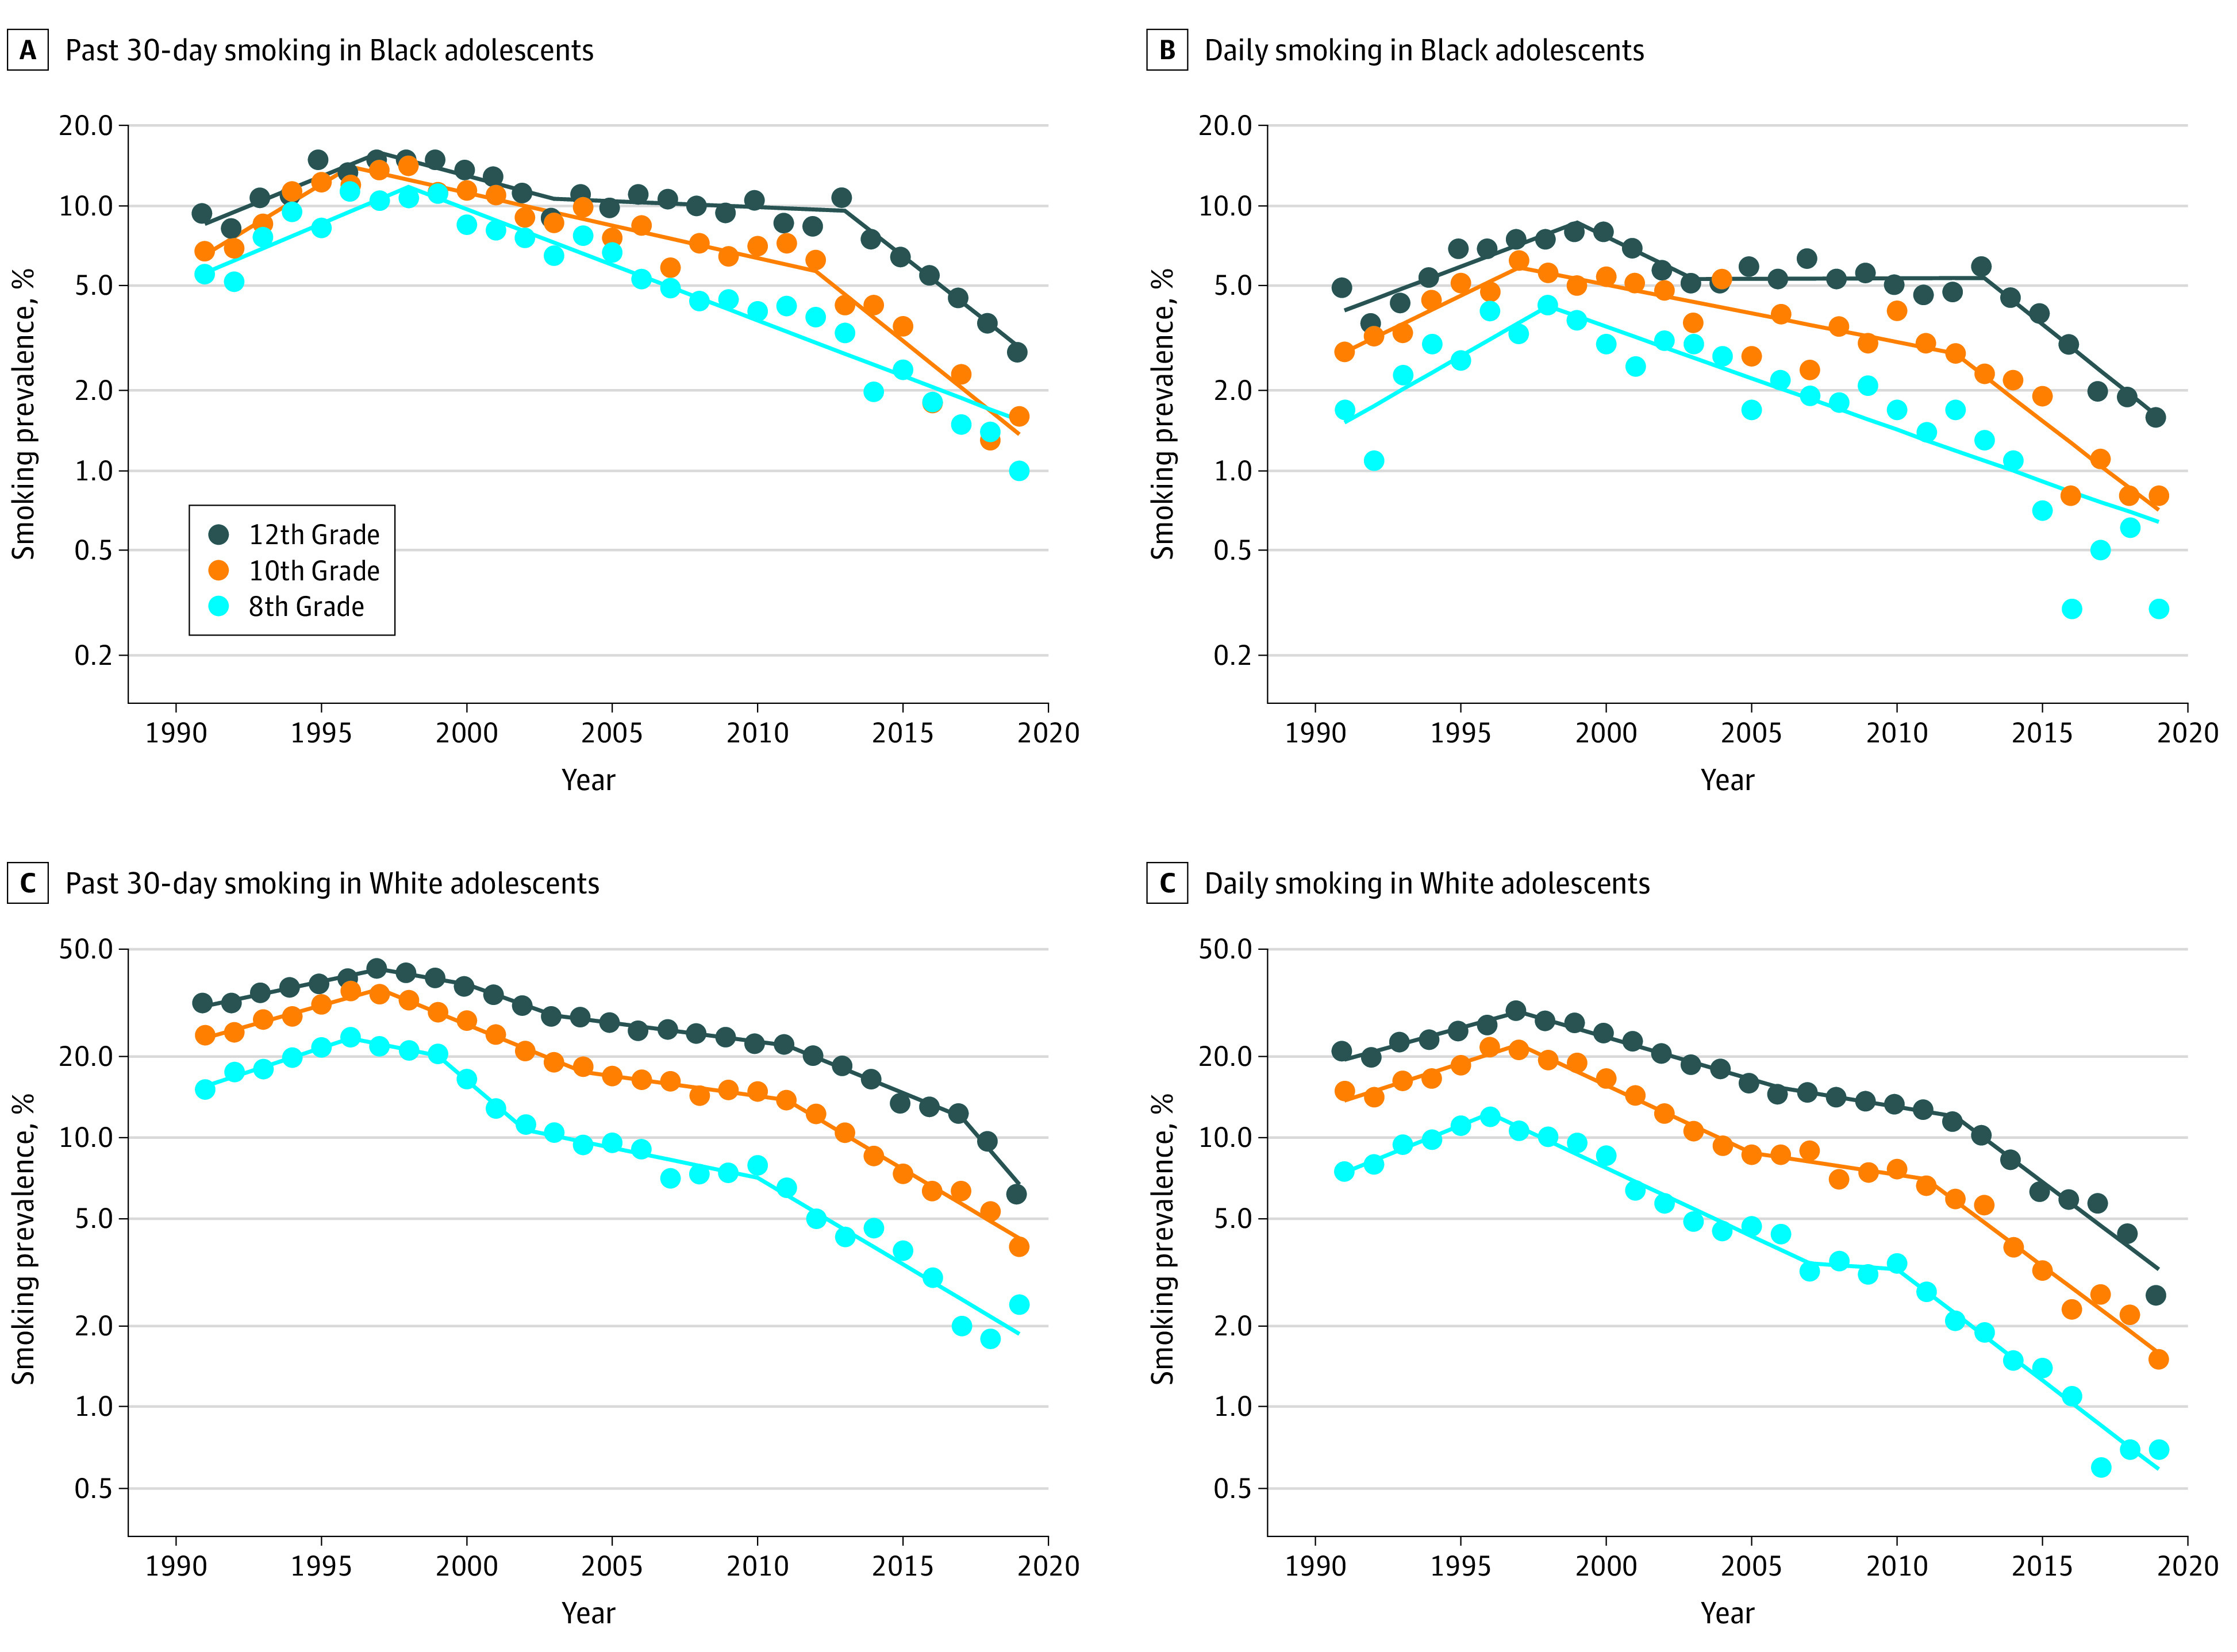
Figure 2. Past 30-Day and Daily Cigarette Smoking Prevalence Among Adolescents by Race (White and Black) and Grade From 1991 to 2019.

The dots represent the annual Monitoring the Future prevalence estimates, and the lines correspond to the best-fitting joinpoint model (Table 2). Data are plotted on a logarithmic scale. Notice the different scales between White and Black adolescent smoking prevalence.
