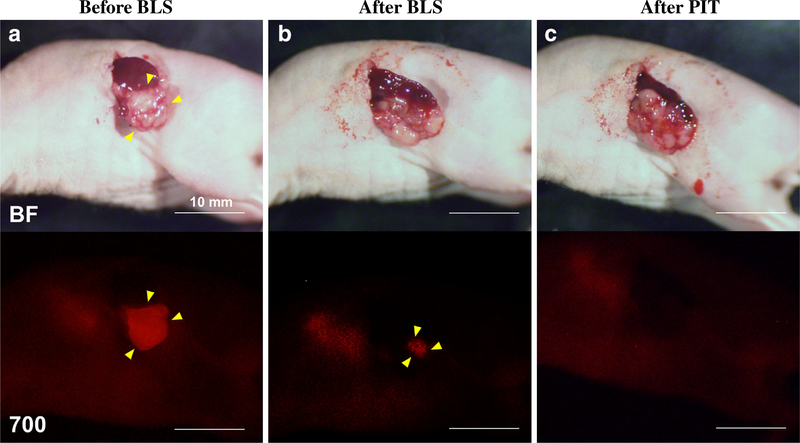
FIG. 2.
Representative images of treated mice. Upper panels are bright field (BF) images and lower panels are fluorescence images with IR 700 (700). Anti-CEA-IR700 brightly illuminated the PDOXs (a). Fluorescence signals from the residual tumors after BLS were still bright (b), and those signals disappeared after PIT treatment (c). Yellow arrowheads indicate tumors. Scale bars 10 mm

