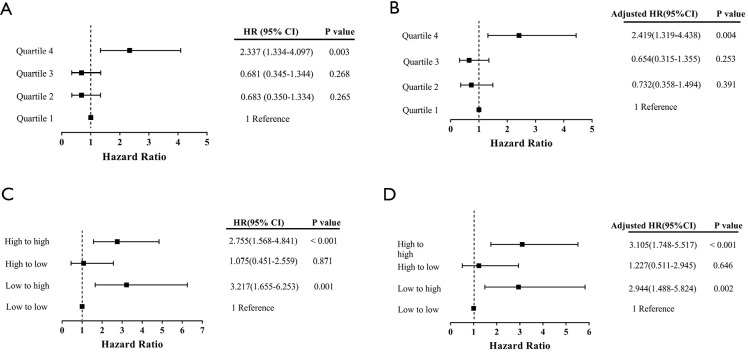
Figure 4.
Association between longitudinal change in cardiac troponin I levels and adverse events. Change in cTnI concentrations is expressed in quartiles: quartile 1 <−0.0768 µg/L, −0.0768 µg/L ≤ quartile 2 ≤0.000 µg/L, 0.000 µg/L < quartile 3 ≤0.0908 µg/L, quartile 4 >0.0908 µg/L. Change in cTnI concentrations is expressed in trends according to cTnI concentrations at the first and second sampling times relative to the median of each time: high to high, high cTnI-1 and high cTnI-2 concentrations; high to low, high cTnI-1 and low cTnI-2 concentrations; low to high, low cTnI-1 and high cTnI-2 concentrations; low to low, low cTnI-1 and low cTnI-2 concentrations. cTnI-1, measurement of cardiac troponin I levels less than 1 hour after CABG; cTnI-2, measurement of cardiac troponin I levels between 12–18 hours after coronary artery bypass grafting; cTnI-1, cardiac troponin I.

