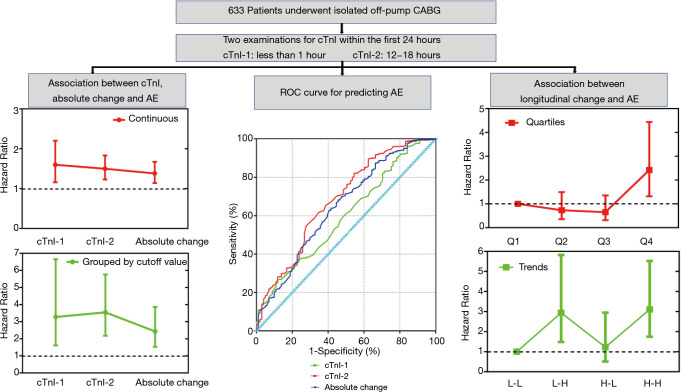
Figure 5.
Central illustration of the association of early troponin I level and its longitudinal change with postoperative 30-day composite adverse events. Change in cTnI concentrations is expressed in quartiles: quartile 1 <−0.0768 µg/L, −0.0768 µg/L ≤ quartile 2 ≤0.000 µg/L, 0.000 µg/L < quartile 3 ≤0.0908 µg/L, quartile 4 >0.0908 µg/L, with quartile 1 as the reference. Change in cTnI concentrations is expressed in trends according to cTnI concentrations at the first and second sampling times relative to the median of each time: H-H, high cTnI-1 and high cTnI-2; H-L, high cTnI-1 and low cTnI-2; L-H, low cTnI-1 and high cTnI-2; L-L, low cTnI-1 and low cTnI-2, with L-L as the reference. Absolute change in cTnI levels is defined as the absolute value of the first cTnI concentration minus the second cTnI concentration. The cutoff value was identified by the maximum Youden index value, and the group whose cTnI concentration was less than the cutoff value was used as the reference. CABG, coronary artery bypass grafting; AE, adverse events; ROC, receiver operating characteristic curve; cTnI-1, measurement of cardiac troponin I levels less than 1 hour after CABG; cTnI-2, measurement of cardiac troponin I levels between 12–18 hours after coronary artery bypass grafting; cTnI-1, cardiac troponin I.

