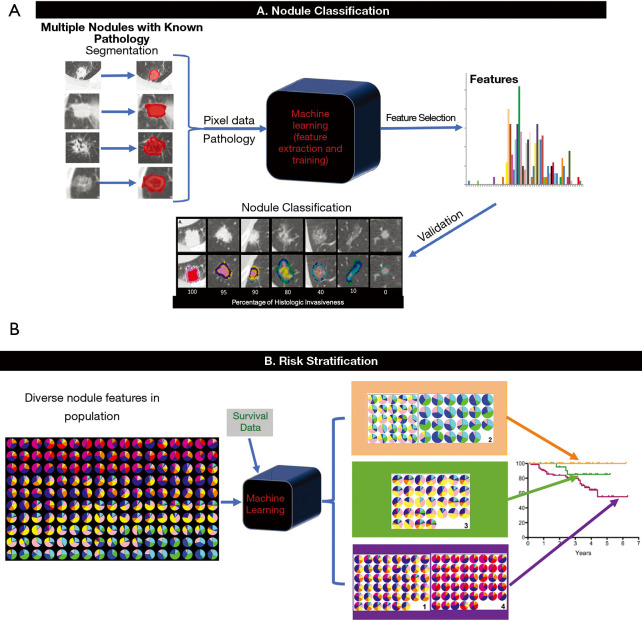
Figure 3.
General illustration of a feature based machine learning nodule classification and risk stratification model [modified from Computer-Aided Nodule Assessment and Risk Yield (CANARY), Mayo Clinic, Rochester, MN, USA]. (A) Nodule Classification. After nodule segmentation, radiomic features are extracted from the images. Following feature-pathology correlation and feature selection, the machine learning model is trained to classify pulmonary nodules. There is typically a validation step with a separate set of data to further refine the algorithm before final testing prior to use. (B) Risk stratification. Multiple nodules with features representative of the population and the corresponding survival data are used to train the algorithm, which in turn classifies the features into three main groups in the case of CANARY and performs survival analysis of each group of nodules (the orange group has good, the green group has intermediate and the purple group has poor prognosis).

