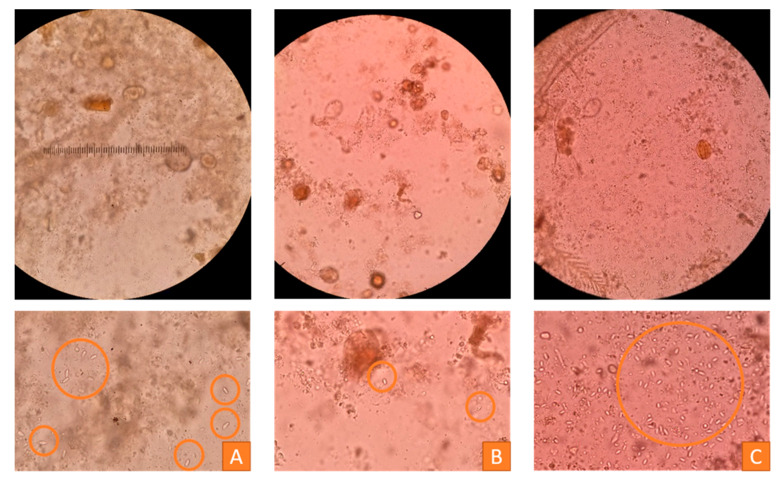
Figure 12.
Microscopic investigation of bee samples of two honeybee colonies to estimate nosemosis infestation (400×), orange circles = Nosema spores (oval-shaped, 4–7 µm in length, 2–4 µm in width), upper row = visual fields, lower row = close-ups. (A) Sample of a colony with a moderate infestation (between 20 and 100 spores per visual field), (B) sample of a colony with a slight infestation (less than 20 spores per visual field), (C) sample of a colony with a severe infestation (more than 100 spores per visual field), © Julia Dittes.

