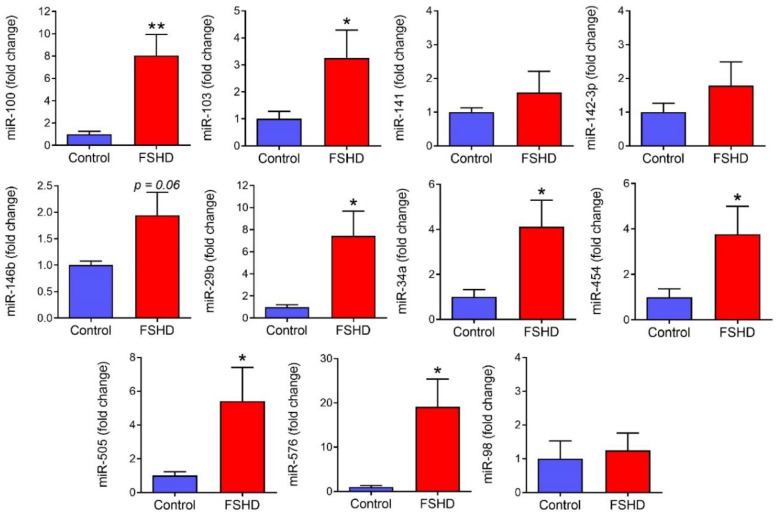
Figure 4.
Expression of candidate miRNAs in a validation group of FSHD patients. Candidate miRNAs that increased in the FSHD discovery experiment were assayed via individual qRT-PCR assay in a separate validation group of FSHD1 patient plasma samples. Expression levels of each miRNA are expressed as fold change versus healthy control volunteers. (values are mean ± SEM, * p ≤ 0.05, ** p ≤ 0.01, one-tailed t-test comparing FSHD1 to control in direction of Discovery experiment; one outlier removed from miR-34a and miR-576 after significant Grubb’s outlier test; n = 7 healthy control volunteers, 12 FSHD1).

