Figure 1.
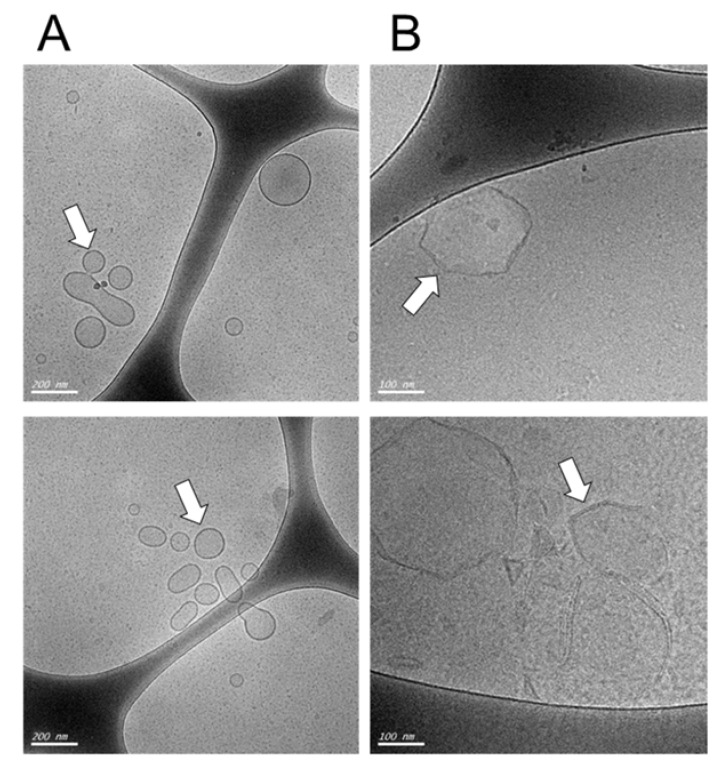
Visualization of cationic liposomes before (A) and after (B) plasmid loading. The cationic liposomes were visualized by Cryo-TEM microscopy at different scales, in (A), the scale bar is 200 µm, in (B) the scale bar is 100 nm. The arrows indicate the liposomal structures. Note that the liposomes show a change in their initial smooth surface to a more rugged appearance after plasmid loading.

