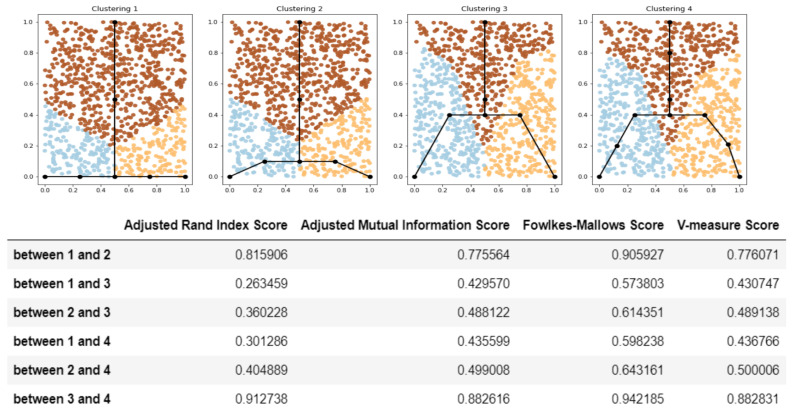
Figure 2.
Example—trajectory comparison results. Trajectories which are close to each other from visual point of view are close by introduced similarity scores (as well as induced clusterings are visually similar). For example: trajectory 1 is visually similar to 2, but less to 2 and even less to 3,4, the scores in the table shows the same ordering. Despite graphs 3 and 4 are quite different in the sense of graph theory (three nodes are added to graph 3 to obtain graph 4), but trajectories for them are almost identical, and thus clusterings are similar and their similarity scores are quite high. That illustrates the main desired property—scores depend on trajectories not graphs themselves.

