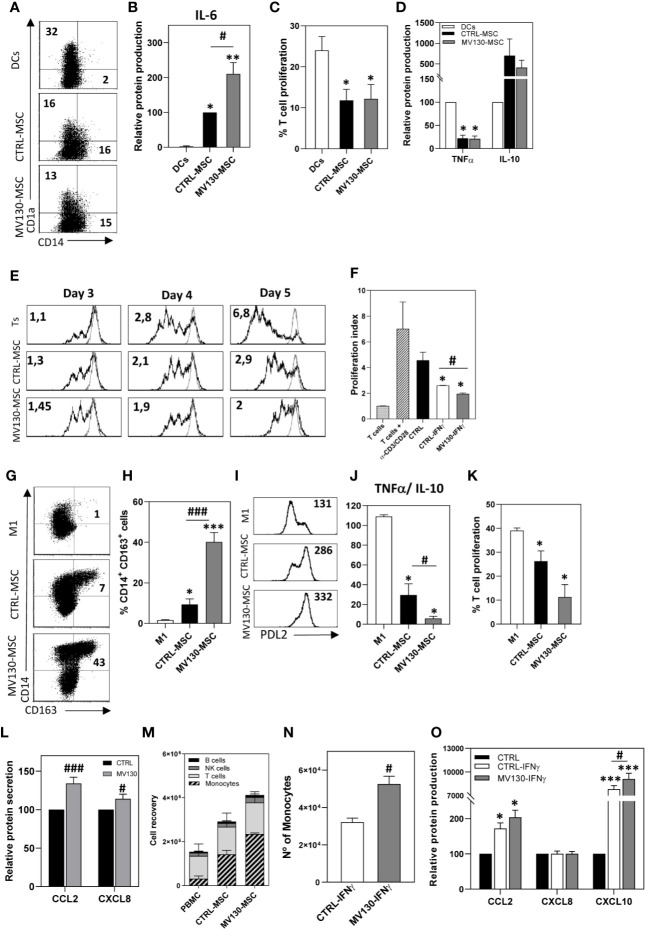
Figure 4.
Immunomodulatory abilities of MSCs after activation with MV130. (A–D) Phenotype and function of monocyte-derived DCs differentiated in the presence or absence of CTRL-MSCs or MV130-MSCs. At day 6, CD1a and CD14 expression were analyzed by flow cytometry in the CD90- population. The percentage of positive cells is shown in each plot (A) and IL-6 production was measured in the supernatants (B). Results represent the mean ± SEM (n = 6). (C, D) DCs stimulated with LPS were cultured in MLR assays with CFSE-labeled T lymphocytes. After 5 days, the percentage of proliferating T cells was calculated by CFSE dilution method (gated on CD3+ cell population) (C) and supernatants from MLR co-cultures were analyzed for TNFα and IL-10 protein secretion (D). Data represent the mean ± SEM (n = 3–5). (E) Control or MV130-MSCs were co-cultured with CFSE-labeled T lymphocytes stimulated with CD3/CD28 beads, for different times. Histograms show CFSE staining in proliferating T cells in CD3+ gated cells. Proliferation index referred to unstimulated T lymphocytes (gray line) is indicated. Data are representative from four independent experiments. (F) MV130-MSCs re-stimulated with IFNγ, following protocol described in Material and Methods, were co-cultured with CFSE labeled T lymphocytes. Proliferation index is shown. Bar graph shows mean ± SEM (n = 4). (G–K) Control and MV130 primed MSCs were co-cultured with monocytes in the presence of GM-CSF to induce M1 macrophage differentiation. Monocytes alone were cultured as M1 control. (G–I) After 6 days, CD14, CD163 and PD-L2 expression was determined by flow cytometry in non-MSC population (CD90- cells) (n = 5–6). A representative experiment (G) and mean ± SEM of percentage of CD14+CD163+CD90- cells from five to six independent experiments (H) are shown. (I) Representative PD-L2 expression on macrophages. MFI is shown in each histogram. (J) After 6 days of co-culture, LPS was added and supernatants were analysed for TNFα and IL-10 production. Data represent TNFα/IL-10 ratio production at the different experimental conditions (mean ± SEM; n = 4). (K) Macrophages stimulated with LPS were used to carry out MLR cultures with CFSE-labeled T lymphocytes. After 5 days, the percentage of T cell proliferation was measured in the CD3+ cell population. (L) CCL2 and CXCL8 protein secretion measured in control and MV130-MSC culture supernatants. Bars represent the mean ± SEM relative to individual controls from 15 independent experiments. (M) PBMCs were placed in a transwell insert while MSCs, treated with or without MV130 for the 24 h previous, and seeded in the bottom chamber. After 8 h, migrating PBMCs (present in the lower chamber) were collected and stained for CD14, CD56, CD3, HLA-DR, and CD19, and different leukocyte populations were analyzed by flow cytometry. MSCs were excluded from the analysis by CD90 expression. (mean ± SEM; n = 4) (N) PBMCs migrating toward control or MV130 primed MSCs re-stimulated with IFNγ. Monocyte recruitment was analyzed by flow cytometry (mean ± SEM, n = 4). (O) Supernatants from MSC cultures following the protocol described in Material & Methods section were analyzed for CCL2, CXCL8, and CXCL10 protein secretion after IFNγ re-stimulation. Results represent mean ± SEM of four to six independent experiments relative to individual controls. (*p < 0.05; **p < 0.01, ***p < 0.005 significances relative to M1-macrophages or DC; #p < 0.05; ###p < 0.005 significances relative to CTRL-MSCs by Wilcoxon test).

